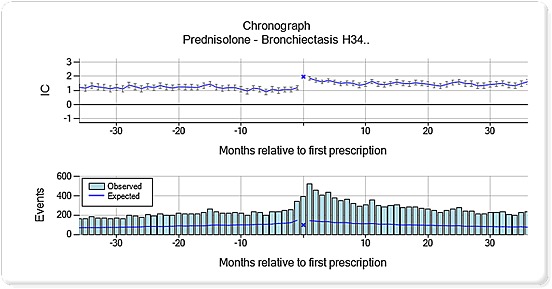
Figure 4.

Chronograph for prednisolone and bronchiectasis (Read code H34). The top panel displays a shrunk logarithm of the observed‐to‐expected ratio (moderated towards the baseline value of one, when the observed or expected counts are low) denoted IC = information component. The bottom panel displays the underlying observed and expected counts
