
Figure 4.
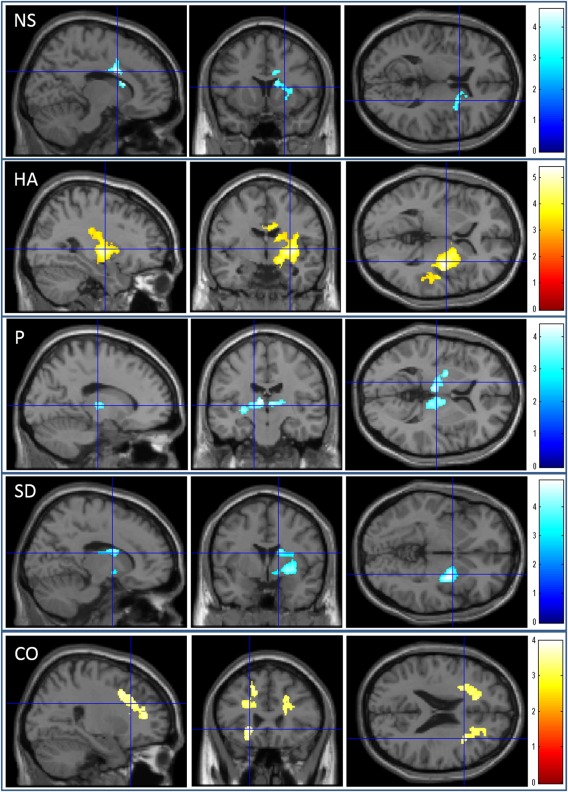
Regions with significant correlations between MD and the personality trait scores. The results shown were obtained using a threshold of the corrected cluster size tests and with an underlying voxel level of P < 0.001 uncorrected. Regions of significant correlation are overlaid on a “single subject” T1 SPM5 image. NS = novelty seeking. HA = harm avoidance. P = persistence. SD = self‐transcendence. CO = cooperativeness. The red color represents positive correlations. The blue color represents negative correlations. The color bars indicate the t scores. Regions that exhibited a significant negative correlation with novelty seeking were observed in the right basal ganglia, right anterior cingulate cortex, and adjacent areas. Regions that exhibited a significant positive correlation with harm avoidance were observed in the right basal ganglia, right middle cingulate cortex, and right posterior insula. Regions that exhibited a significant negative correlation with persistence were observed in the bilateral thalamus, left globus pallidus, and left putamen. Regions that exhibited a significant negative correlation with self‐transcendence were observed in the right basal ganglia, right insula, and adjacent regions. Regions that exhibited a significant positive correlation with cooperativeness were observed in the areas located around the anterior cingulate cortex, dorsolateral prefrontal cortex, insula, and orbitofrontal cortex in the left hemisphere, and the areas located around the anterior cingulate cortex and dorsolateral prefrontal cortex in the right hemisphere.