
Figure 4.
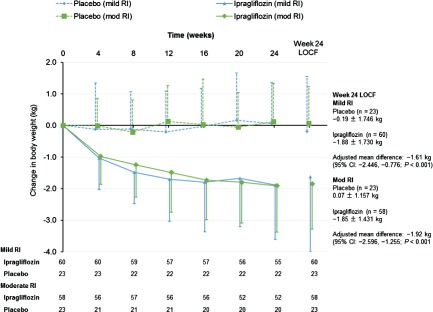
Change in body weight from baseline to endpoint in patients with mild or moderate renal impairment (RI) according to treatment group. The changes from baseline to week 24 are also shown with the LOCF to impute missing data. Data are shown as the mean ± standard deviation.