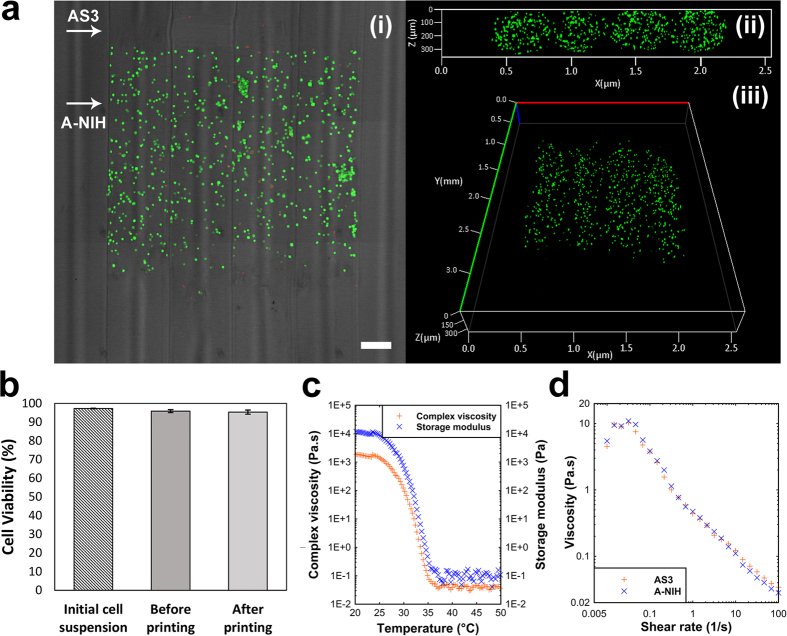
Figure 6. Patterning cell encapsulated regions within a printed object.
(a)(i–iii) Confocal images of a sample with patterned encapsulated NIH 3T3 cells inside. (i) Top view of the projected z stacks on XY plane combined with phase contract image; scale bar, 250 μm. (ii,iii) Fluorescent images of cross section and perspective views of the sample. (b) Results of cell viability assay at Day 0 prior and after printing compared to control sample. (c) Viscosity and storage modulus of AS3 ink as a function of temperature. Gelation was determined by G′-G′′ crossover point at 35 °C and viscosity of ink increased significantly by decreasing temperature. Ink has shown liquid like behavior while it was kept at 38 °C in ink’s reservoir. (d) Shear thinning behavior of AS3 and A-NIH inks at 38 °C. Viscosity dropped significantly by increasing shear rate.

