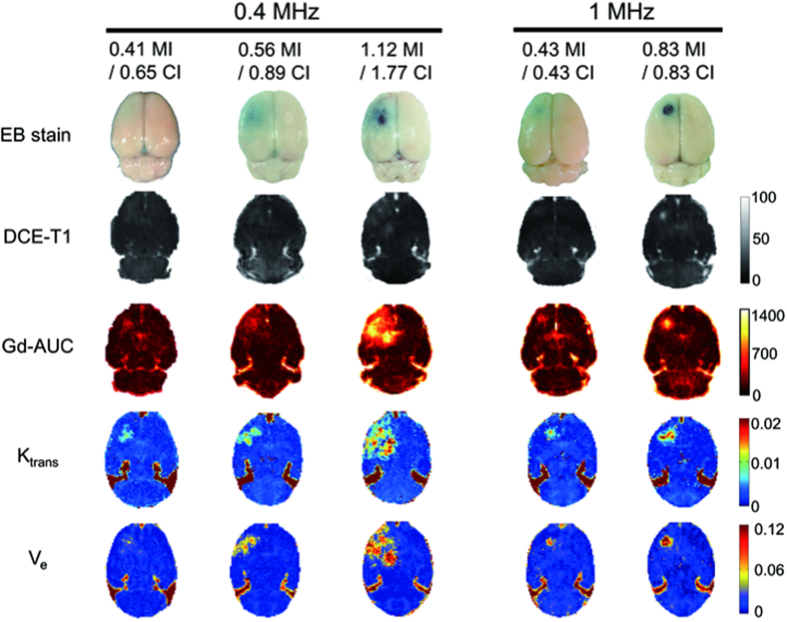
Figure 1. Representative gross views of EB-stained brains and post-processed DCE-MRI parameters including the signal-intensity (SI) maps, Gd-based area-under-curve (Gd-AUC) maps, Ktrans maps, and Ve maps at various MI/CI exposure levels.
The scale of BBB-opening increases with MI/CI for both the 0.4-MHz FUS group and the 1-MHz FUS group. The mild BBB-opening caused by low MI/CI with 1-MHz FUS was similar to the BBB-opening of low MI/CI 0.4-MHz FUS. The higher MI/CI 0.4-MHz FUS and higher MI/CI 1-MHz FUS induced aggressive BBB-opening accompanied by erythrocyte extravasations. The FUS dimension is larger in 0.4-MHz than in l-MHz, therefore 0.4-MHz exposure contributed to a larger BBB-opening dimension.

