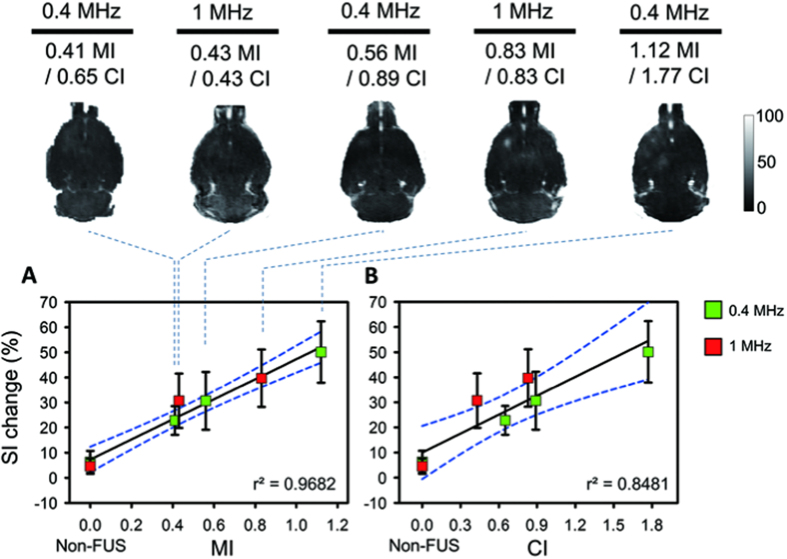
Figure 2. Gd-DTPA enhanced T1-weighted maps and correlations of MI/CI with SI change within 10 min.
SI change was increased as a function of MI/CI change. (A) The correlation between MIs and SI changes. The non-FUS side serves as 0 MI. The SI increase was monotonically increased as a function of MI change regardless of exposure frequency. (B) The correlation between CIs and SI changes. The non-FUS side serves as 0 CI. The correlation of CI and SI change decreased but was still sufficiently high.

