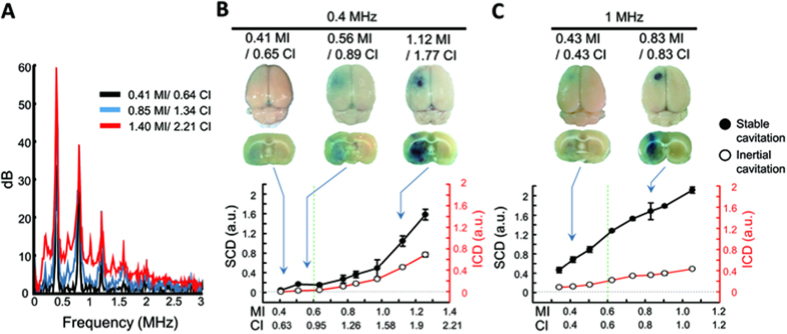
Figure 7. PCD analysis from inertial cavitation and stable cavitation during various FUS levels.
(A) Typical spectrum change of backscattered signals with increased MI/CI. The subharmonic/ultraharmonic emissions and wideband emissions increased with MI/CI. (B) SCD and ICD of 0.4-MHz burst-FUS. The SCD occurred before the ICD and both doses increased with FUS exposure level. (C) SCD and ICD of 1-MHz burst-FUS. SCD and ICD both increased with the FUS exposure level, indicating that stable and inertial cavitation could be enhanced by and dependent on FUS level.

