
Figure 8. Fungicide contributions to HQbbread by sampling period and crop pollinated.
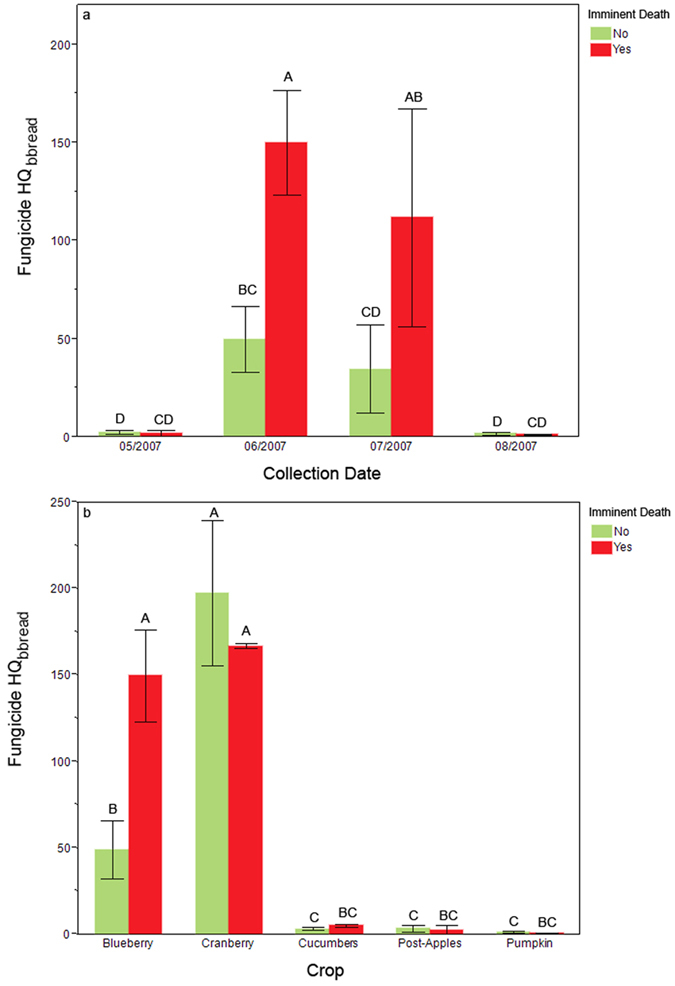
During the summer season elevated mean fungicide HQbbread (±S.E.) were linked with colony death 1 month later in June and July. Fungicide HQ varied significantly by crop. (a) Fungicide HQ by sampling period; (b) Fungicide HQ by crop. Different letters indicate significant differences. Red = pooled samples in which at least one colony dies before the next sampling period; green = pooled samples where all colonies are still alive during the next inspection.