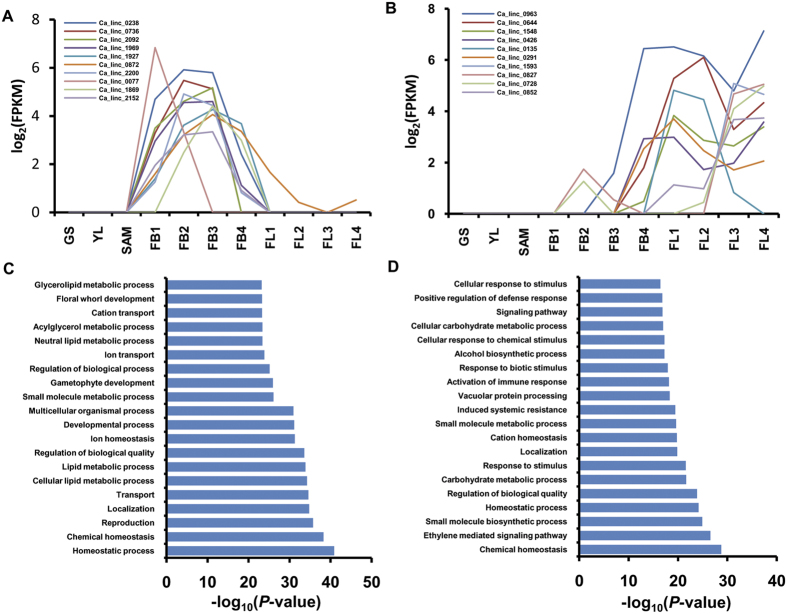
Figure 4. Flower bud and flower specific expression patterns of lincRNAs and GO enrichment analysis.
(A,B) Expression pattern of 10 highly expressed lincRNAs in flower bud (A) and flower (B) stages of chickpea. Normalized expression (FPKM) of lincRNAs in different tissues has been presented in the line graph. Expression pattern of all the highly expressed lincRNAs in flower bud and flower stages of chickpea is given in Supplementary Fig S3. (C,D) Gene ontology enrichment for lincRNAs expressed only in flower bud (C) and flower (D) tissues. Top GO terms showing very high enrichment (P-value < e−10) are shown.

