
Figure 3. Scatter plot of differentially expressed genes (DEGs) between the FU_1 and FU_2 libraries in P. sinensis.
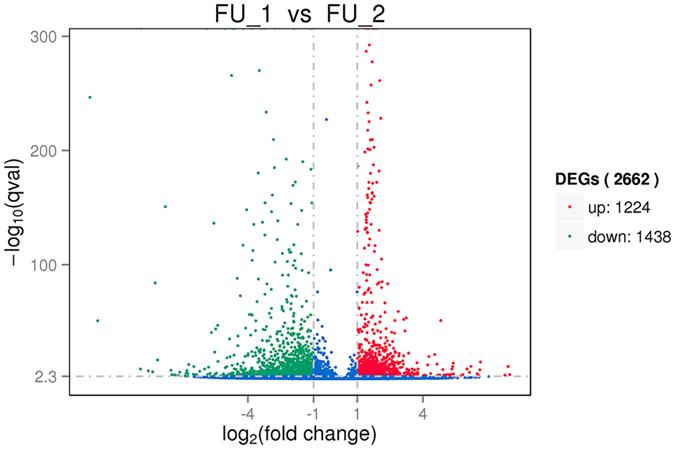
The red and green dots represent up- and down-regulated genes in P. sinensis, respectively. The blue dots represent the genes without significant differential expression.