
Figure 5. Expression validation of selected DEGs related to sperm storage in P. sinensis.
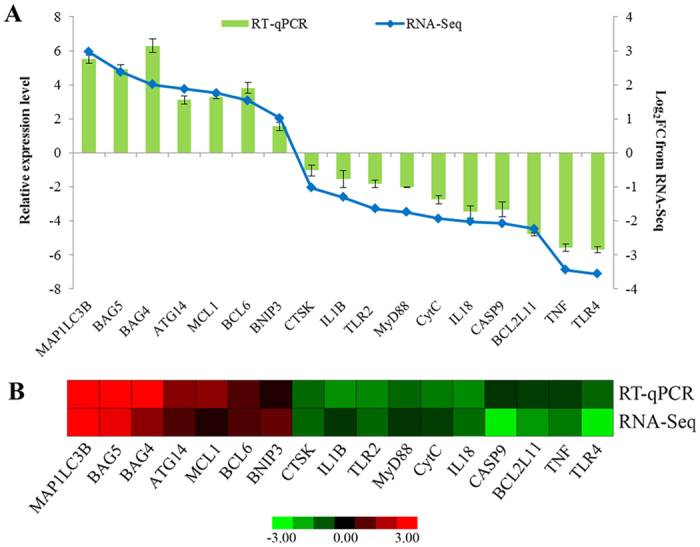
(A) The relative expression levels of DEGs by RT-qPCR (green bar) were compared with the transcript abundances from RNA-Seq (blue bar). (B) Heat map diagram of the expression patterns of DEGs in P. sinensis. The red and green colours indicate up- and down-regulated genes in the FU_2 library compared with those in the FU_1 library, respectively.