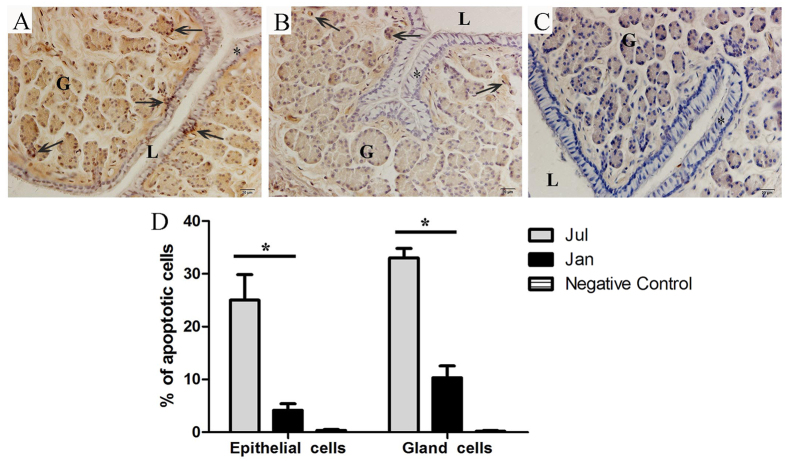
Figure 7. Representative photographs of TUNEL staining in July (A), January (B), negative control (C) of the oviduct, and the counting of the TUNEL positive cells (D).
Epithelium (*), gland cell (G), lumen (L), TUNEL positive cells (↑). Scale bar = 20 μm. The values (*) obtained in July were significantly higher (P < 0.05) than those obtained in January.

