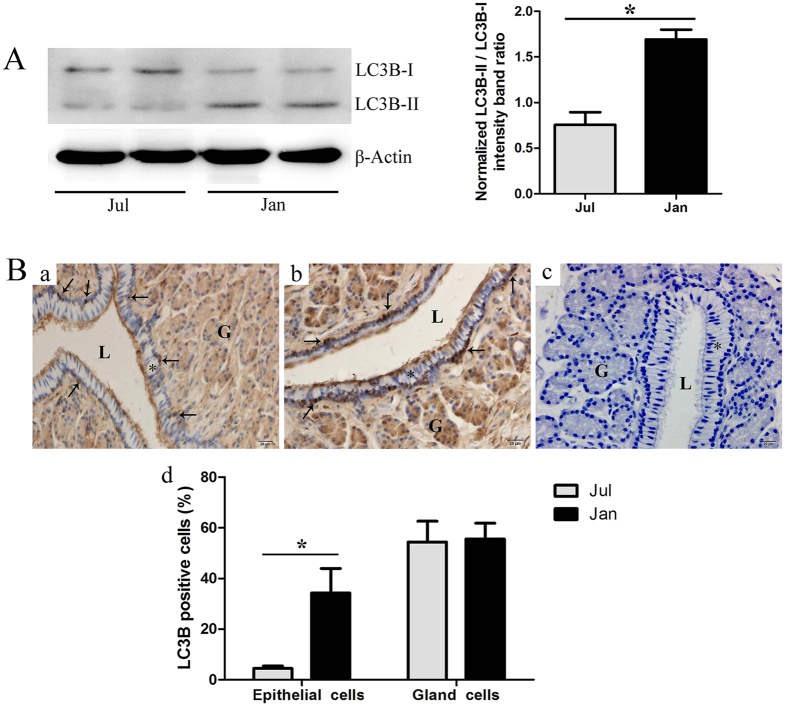
Figure 8. LC3B protein expression in the P. sinensis oviduct during the reproductive (July) and hibernation (January) seasons.
(A) Western blot analysis of LC3B protein expression. The histogram represents densitometric analysis of the immunoblots. (B) Immunohistochemical localization of LC3B. (a) July, (b) January, (c) negative control and (d) the quantification of LC3B positive cells. Epithelium (*), gland (G), lumen (L), LC3B positive cells (↑). Scale bar = 20 μm. The values (*) obtained in January were significantly higher (P < 0.05) than those obtained in July.

