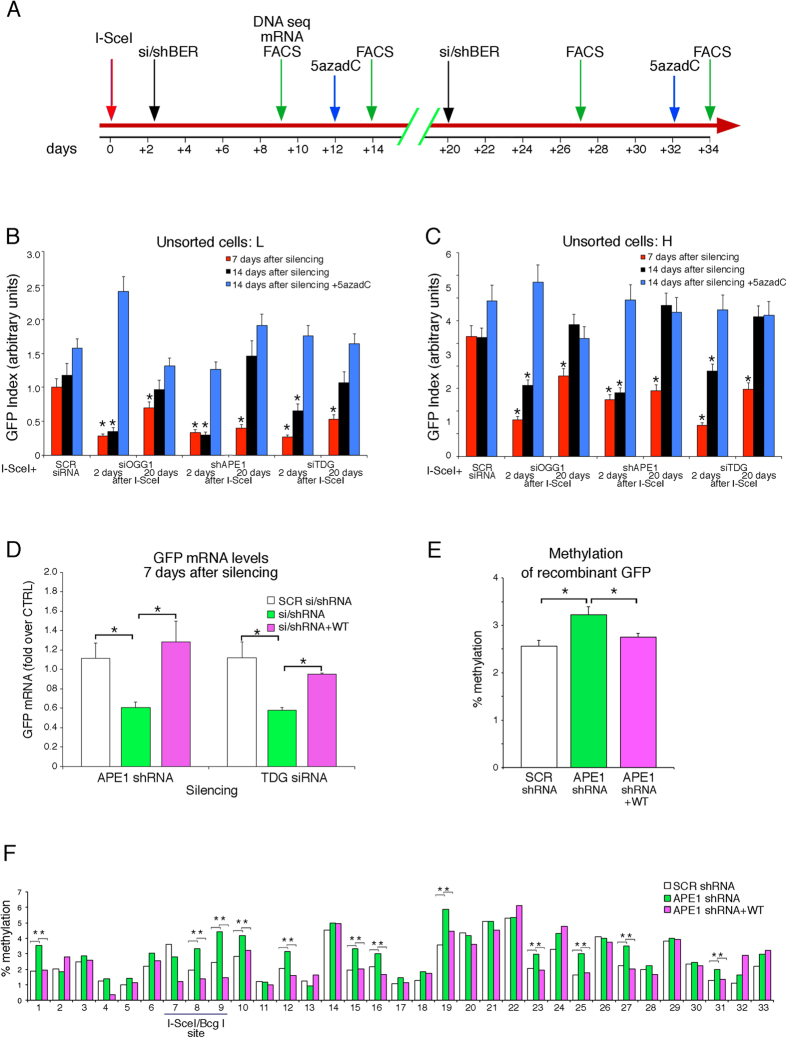
Figure 4. Inhibition of BER early after repair reduces transcription and increases methylation of the repaired DNA.
(A) Chronology of BER-silencing experiments. Time 0 indicates I-SceI transfection and arrows the time of analysis or treatments. GFP+ cells were 10% ± 2% in all treatments. At days 12 and 32, 5-azadC (10 μg/ml, blue arrows) was added for 24 h, removed and 24 h later cells were analyzed. (B,C) Analysis was performed at day 7 (red) or 14 (black) after treatments. GFP index is the product of GFP intensity and reciprocal cell fraction in the fluorescence gate to normalize frequency of GFP+ cells in H and L gates to intensity of signal, to compare different experiments. The data shown derive from 20 independent experiments. (B,C) Show GFP index in Rec H and Rec L cells, respectively. *p < 0.01 (Matched t test) compared to scrambled control. (Supplemental Fig. S3 and Table S2). (D) GFP mRNA levels 7 days after APE1 and TDG-silencing by qPCR for recombinant GFP. TDG protein levels are in Supplemental Fig. S3C. *P < 0.01 (Wilcoxon rank-sum test) compared to scrambled control. (E,F) Methylation analysis of GFP in mass cultures of I-SceI-transfected cells, in which APE1 levels were modified after HR (48 h after I-SceI and analyzed 7 days later, panel A). DNA was subjected to bisulfite analysis and sequenced with Myseq Illumina (Supplemental Table S3). Panel E shows the average methylation of the recombinant GFP. All the cells were exposed to I-SceI and these vectors: SCR shRNA (white shaded) scrambled shRNA; APE1 shRNA (green) shRNA APE1; APE1 shRNA + WT (purple) shRNA APE1 and APE1 expression vector. The percent of methylation of recombinant GFP in all samples is normalized to the recombinant GFP cassette as shown in Supplemental Table S3; data were expressed as the mean ± SEM. *p < 0.01 (t test) compared APE1 shRNA vs SCR shRNA or vs APE1 shRNA + WT. Panel F shows the percent of CpG methylation in recombinant GFP in cells in which the levels of APE1 were modified early after repair. The position of the I-SceI/BcgI site corresponds to CpG 7 and 8. *p < 0.01 (Pearson’s chi-squared test) compared APE1 shRNA vs SCR shRNA (+SceI) or vs APE1 shRNA + WT.

