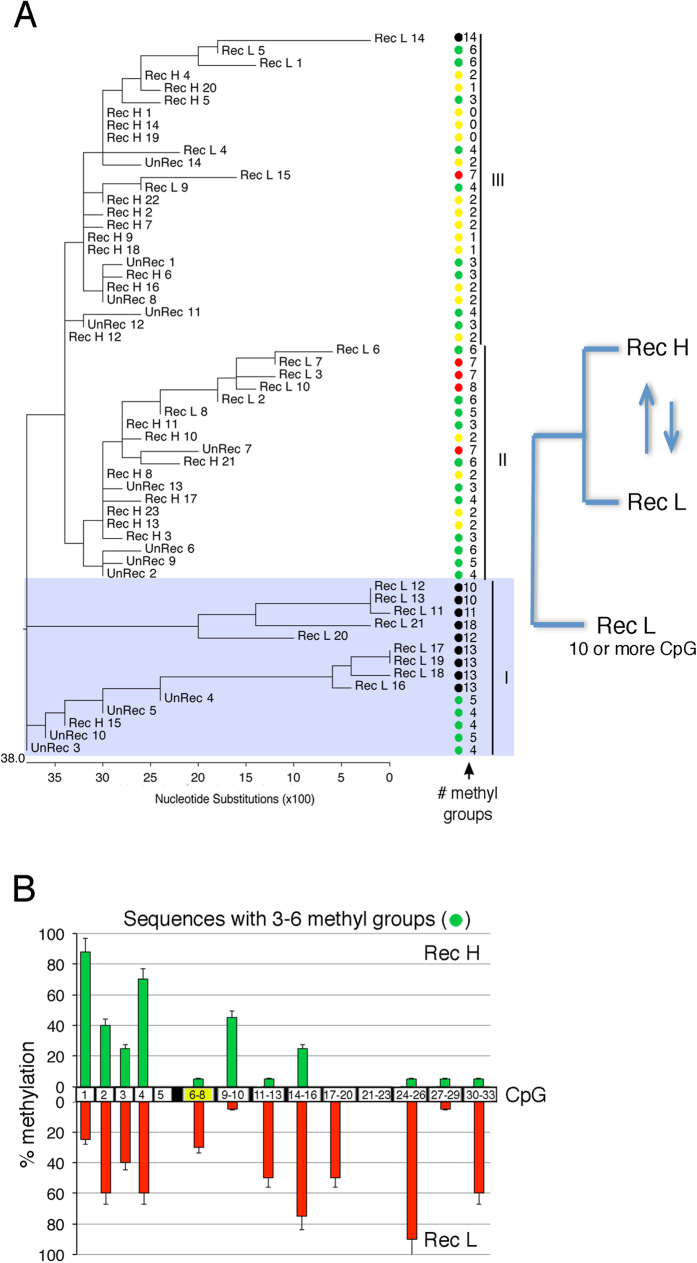
Figure 5. Methylated GFP molecules are polymorphic.
(A) Qualitative analysis of GFP methylation profiles in UnRec, Rec H and Rec L clones. We compared the location of methylated CpGs in the most abundant GFP molecules (above 5–10%) derived from recombinant (Rec H and Rec L) and non-recombinant (UnRec,) cells. The sequence at the I-SceI site in UnRec molecules was edited to BcgI to eliminate the differences in the sequence between Rec and UnRec molecules and to permit the comparison of Rec and UnRec GFP molecules only on the basis of methylation. Cluster analysis (ClustalW) shows three main families of methylated molecules: I, represented essentially by Rec L clones; II and III represented by Rec H and Rec L clones. Colored circles indicate the number of methylated CpGs/molecule. (B) Specific CpGs are methylated in Rec H and Rec L clones following HR. Molecules containing 3 to 6 mCpGs were sorted from Rec H or Rec L cells pools and compared. The location of methylated CpGs at the 5′ and 3′ ends of the DSB is shown relative to the DSB (black-yellow box centered at the 6–8 CpG). Methylation of CpG from 1 to 5 is not modified by DSB or HR (ref. 11). The histograms show the percentage of methylation of the specific CpGs in Rec H (green) and Rec L (red) clones.

