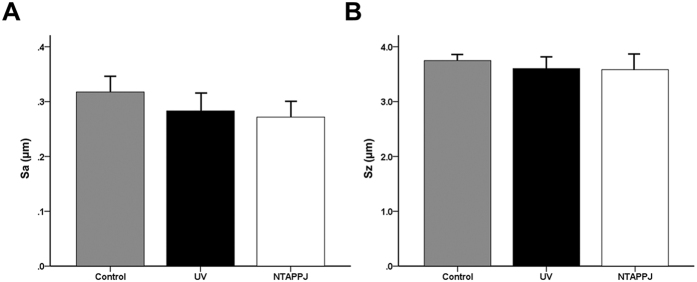
Figure 1. Results of three-dimensional (3D) surface topographic analysis of the titanium disc surface immediately after UV and NTAPPJ compared with that of the control group.
Surface roughness parameters, Sa (A) and Sz (B), were quantitatively measured at a magnification of 10× with a scanning area of 310 μm × 230 μm, and the results were compared between groups.

