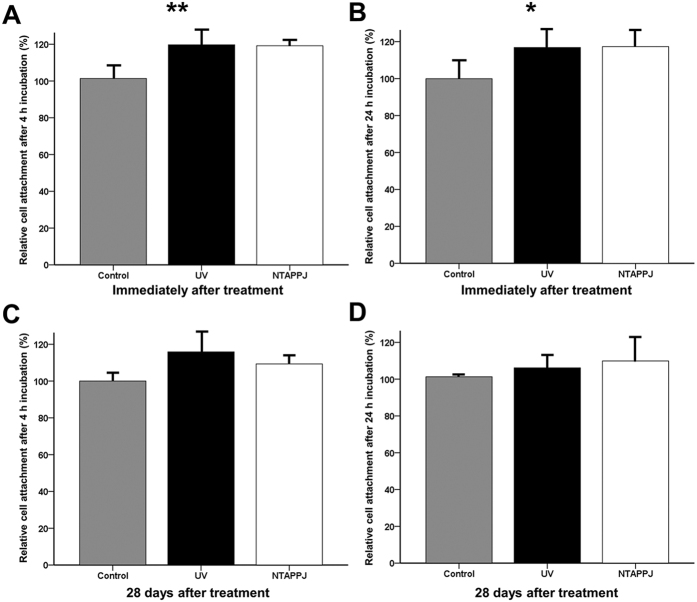
Figure 6. Changes in relative osteoblastic cell attachment rates on the titanium disc surface after treatment over time.
Cell attachment rates immediately after treatment after 4 h (A) and 24 h (B) of incubation and 28 days after treatment after 4 h (C) and 24 h (D) of incubation. *P < 0.05, **P < 0.01 for comparisons between the indicated groups.

