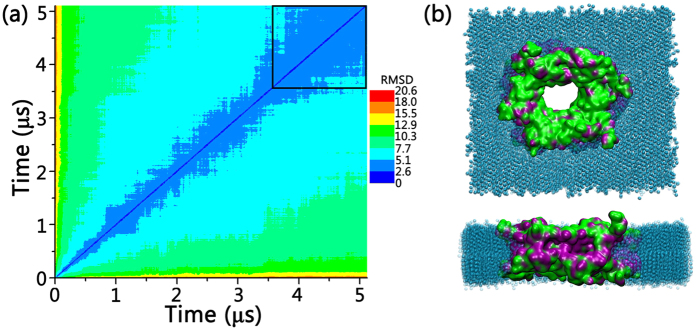
Figure 5.
(a) 2D backbone RMSD matrix plots for wild-type Bax oligomeric pore, and (b) top and side views of the equilibrium Bax six-dimer oligomeric pore. The Bax oligomeric pore in (b) is represented in QuickSurf with the exposed hydrophilic residues colored in green and hydrophobic residues colored in purple. The coarse-grained lipids are shown in VDW in cyan.

