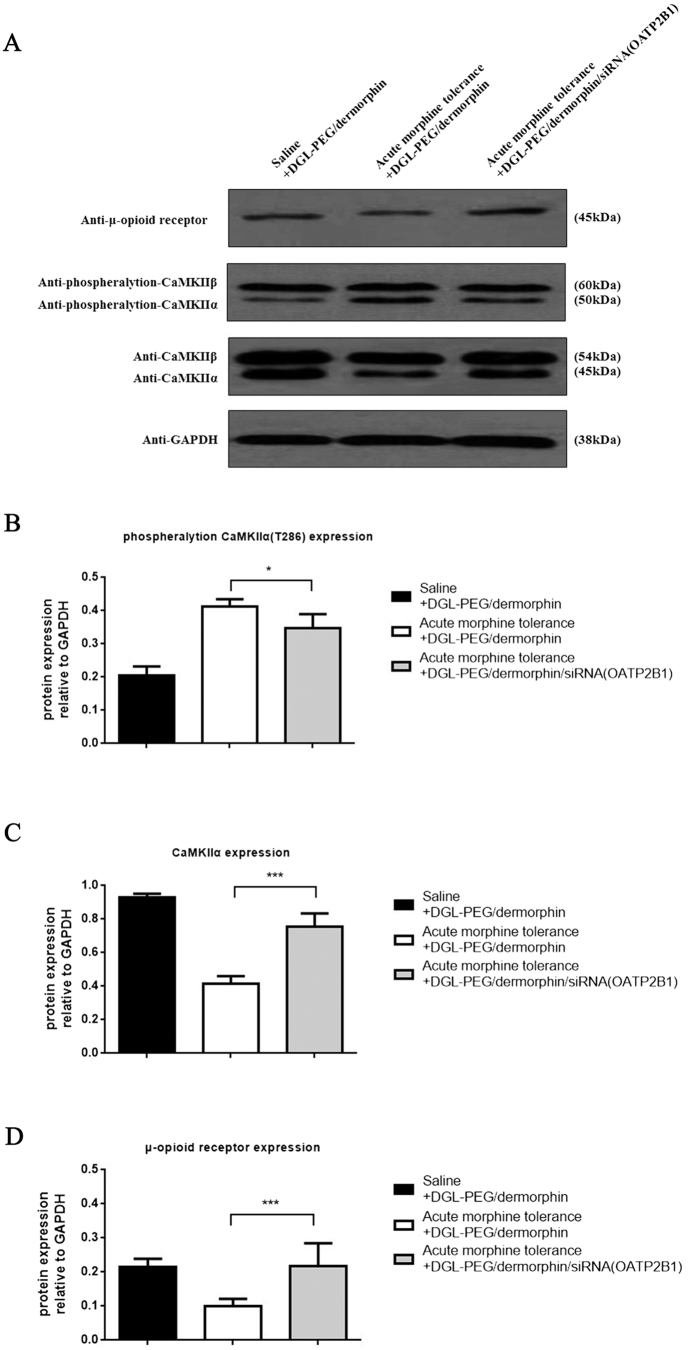
Figure 8. Tolerance correlated proteins expression in mPFCs after brain OATP2B1 inhibition.
(A) phosphorylation of CaMKIIα, CaMKIIα and MOR protein expression in tolerance induced mPFCs with or without brain OATP2B1 knockdown. (B) phosphorylation of CaMKIIα at Thr286, (C) CaMKIIα, (D) MOR protein expressions in mPFCs normalized to average intensity optical density (IOD) values of GAPDH and measured by Image Pro Plus 6.0 software. All experiments were repeated three times under the same condition for counting. Pairwise comparisons were calculated by student t-test (**P < 0.01, ***P < 0.001) (n = 3).

