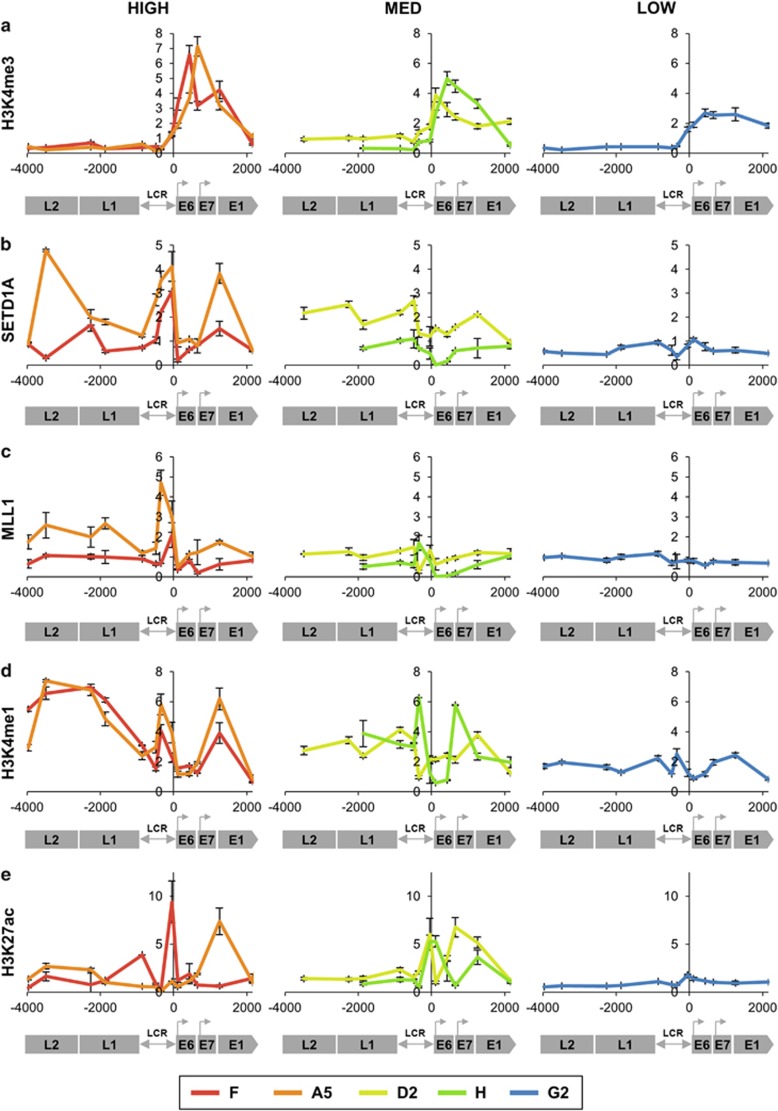
Figure 2.
Associations with active histone PTMs and modifying enzymes. Levels of association of the H3K4me3 histone PTM (derived from four biological replicates) (a) and the associated histone-modifying enzymes SETD1A (three replicates) (b) and MLL1 (four replicates) (c); as well as the transcriptional enhancer marks H3K4me1 (three replicates) (d) and H3K27ac (two replicates) (e). In each graph, the y-axis shows the relative levels of enrichment, normalised to host control target regions (see Supplementary Table S1). The x-axis and underlying schematic show the region of the HPV16 genome analysed. In all panels, data are colour coded according to the key at the foot of the figure. Bars=mean±s.e.m.

