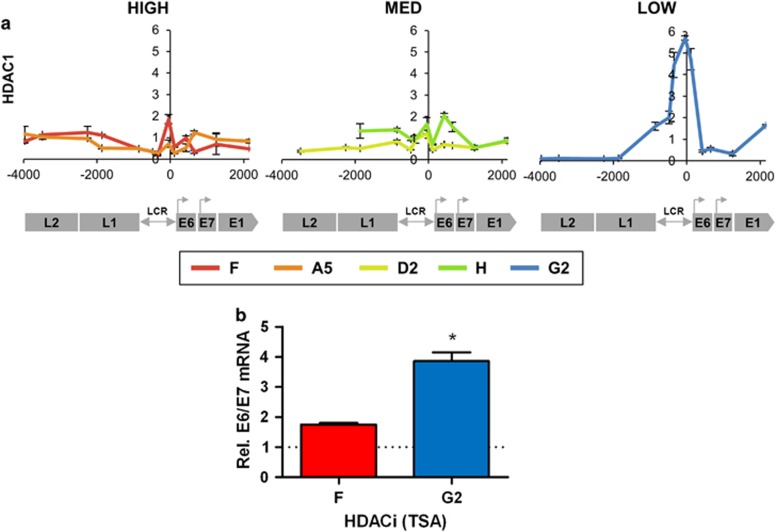
Figure 5.
Associations with HDAC abundance/activity. (a) Levels of association of HDAC1 enzyme. The y-axis shows the relative levels of enrichment, derived from two biological replicates and normalised to host control target regions (see Supplementary Table S1). The x-axis and underlying schematic show the region of the HPV16 genome analysed. (b) Changes in HPV16 E6/E7 transcript levels following type I/type II HDAC inhibition with TSA in clones F and G2, derived from three biological replicates. Bars=mean±s.e.m. P-values (Student's t-test): *P<0.05.

