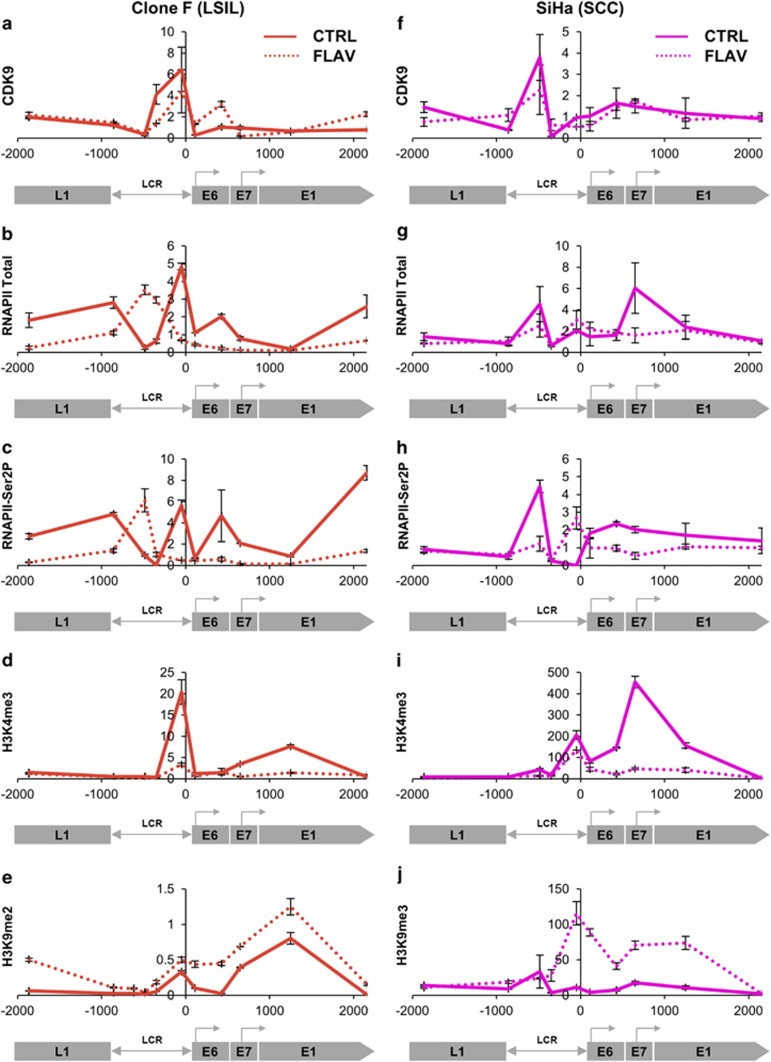
Figure 8.
Effects of CDK9 inhibition. Effects of Flavopiridol in clone F (LSIL phenotype) and SiHa (SCC phenotype). Rows show levels of CDK9 (a, f), total RNAPII (b, g), RNAPII-Ser2P (active/elongating) (c, h), H3K4me3 (active) (d, i) and H3K9me2/3 (repressed) (e, j). In each graph, the y-axis shows the relative levels of enrichment, derived from two biological replicates and normalised to host control target regions (see Supplementary Table S1). The x-axis and underlying schematic show the region of the HPV16 genome analysed. Solid lines=control-treated cells; dotted lines=Flavopiridol-treated cells. Bars=mean±s.e.m.

