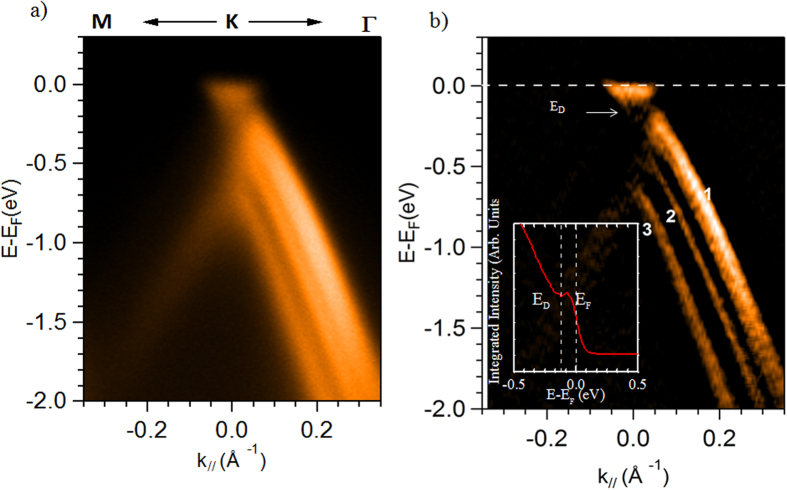
Figure 3. Electronic structure of multilayer graphene.
(a) Angle resolved photoemission spectrum of epitaxial graphene/SiC(0001), revealing the 3 bands structure, signature of trilayer graphene. The spectrum is measured with photon energy of 60 eV and with scans oriented along the ΓK direction of the graphene Brillouin zone, (b) Second derivative of the intensity ARPES data along the ΓK direction of the trilayer graphene, the position of the Dirac point (about 150–200 meV below the Fermi level, see integrated spectrum inset of Fig. 3(b)), is highlighted by a white arrow.

