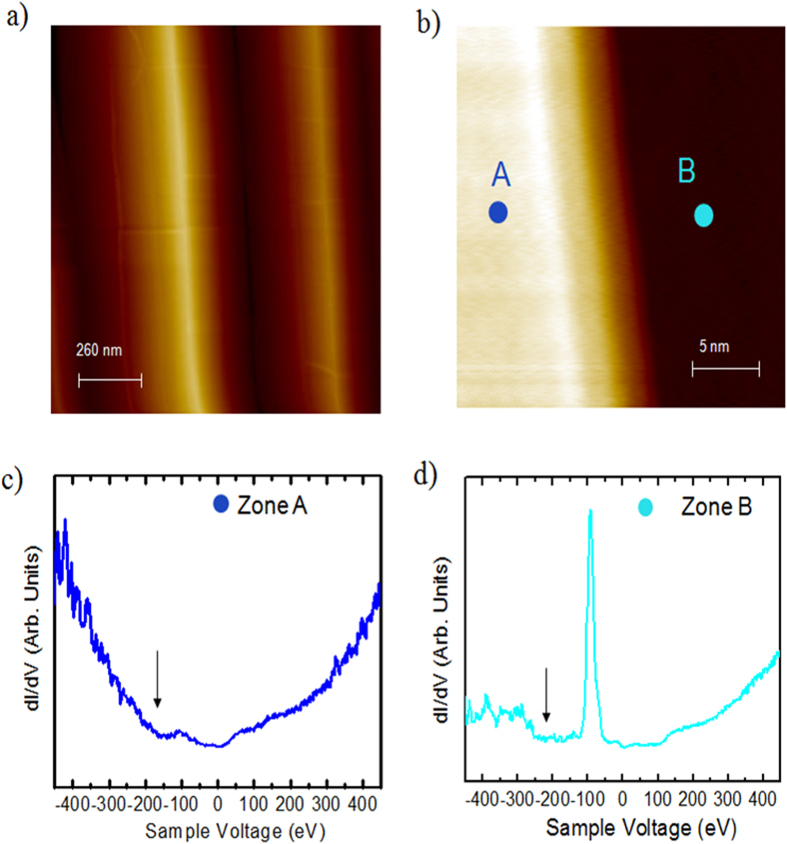
Figure 4. STM/STS studies of trilayer epitaxial graphene (T = 4.2 K).
(a) Large scale STM topographic image (1000 × 1000 nm2, 800 meV, 0.5 nA), (b) STM image of trilayer graphene over a terrace (25 × 25 nm2, 100 mV, 200 pA), (c) STS spectrum acquired in the zone A, left side of the figure (b,d) STS spectrum acquired in the zone B, right side of figure (b). The local minimum in the dI/dV curves highlighted by the arrow indicate the position of the Dirac point.

