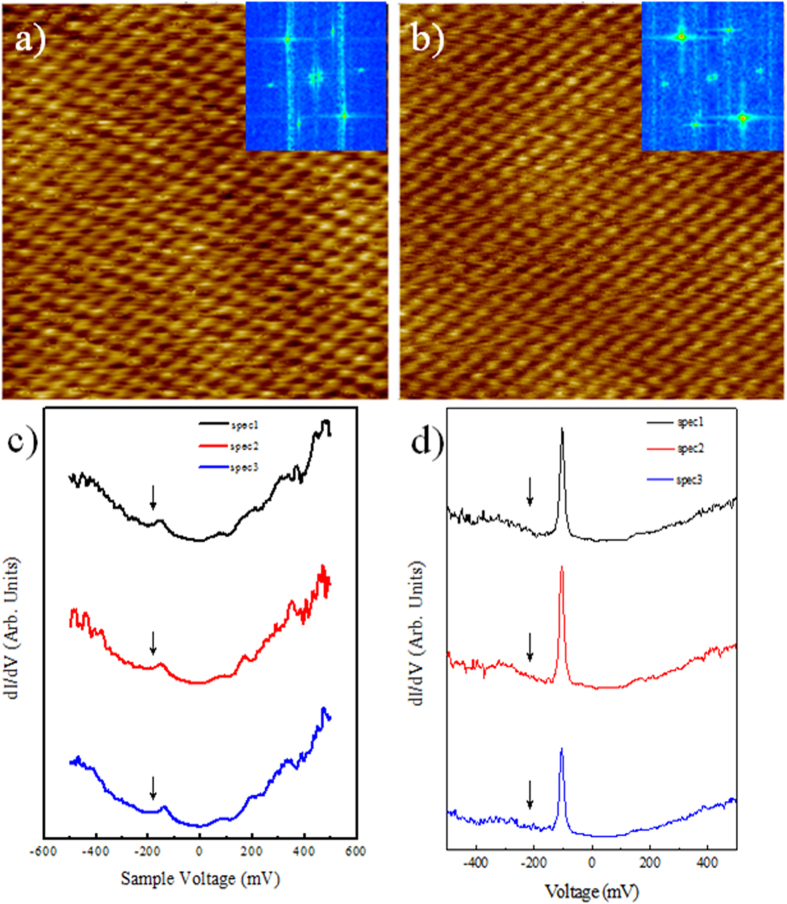
Figure 5. STM/STS studies of trilayer epitaxial graphene (T = 4.2 K) with atomic resolution.
(a,b) Typical atomic resolution STM images of our sample (5 × 5 nm2, 100 mV, 200 pA). In insert the Fourier Transform image of the two phases, (c,d) STS spectra obtained in different positions of figure (a,b), respectively. The local minimum in the dI/dV curves highlighted by the arrow indicate the position of the Dirac point.

