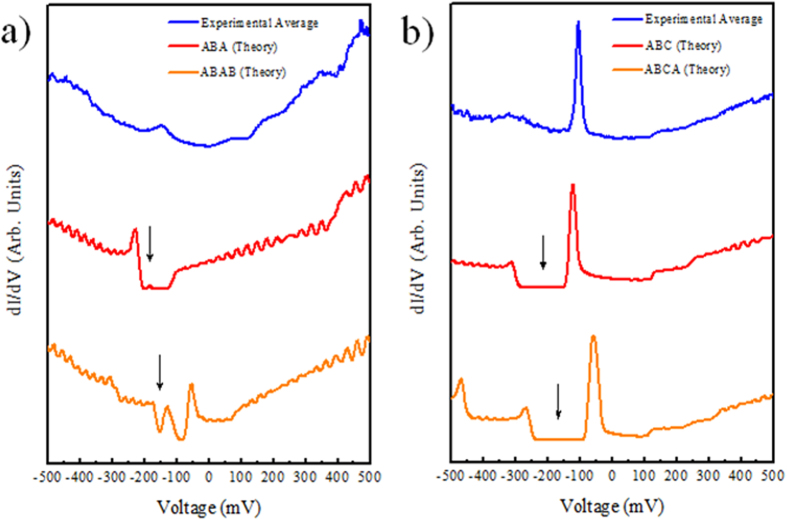
Figure 6. Experimental dI /dV curves for trilayer graphene together with the calculated LDOS.
(a) Experimental vs theoretical STS spectra of three and four layer Bernal stacking, and (b) Experimental vs theoretical STS spectra of three and four layers rhombohedral stacking. The local minimum in the dI/dV curves highlighted by the arrow indicate the position of the Dirac point.

