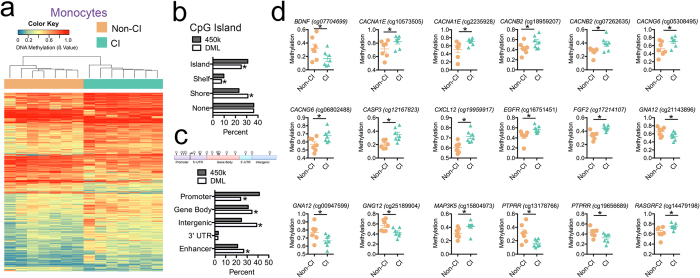
Figure 1. CI-associated DNA methylation differences in monocytes.
(a) Heatmap displaying methylation levels of differentially methylated loci in Non-CI (orange) and CI (green) monocyte samples. Unsupervised hierarchical clustering analysis (Manhattan distance, complete linkage method) above columns identified 2 main clusters: Non-CI (orange) and CI (green). Methylation values displayed as ranging from low methylation (0, blue) to high methylation (1, red). (b) Plot showing percent differentially methylated loci (white) located in CpG islands, shelves, shores, or none compared to percent observed for all probes on the 450k array (grey). * Indicates significant difference. DML, differentially methylated loci. (c) Percent differentially methylated loci (white) located in gene promoters, gene bodies, intergenic regions, 3′ UTR, and enhancer regions compared to percent observed for all probes on the 450k array (grey) shows a significant enrichment for gene body, intergenic, and enhancer regions of the genome. UTR, untranslated region (d) Methylation of DML in Non-CI (orange) and CI (green) monocyte samples located in genes related to MAPK signaling. *P < 0.05.

