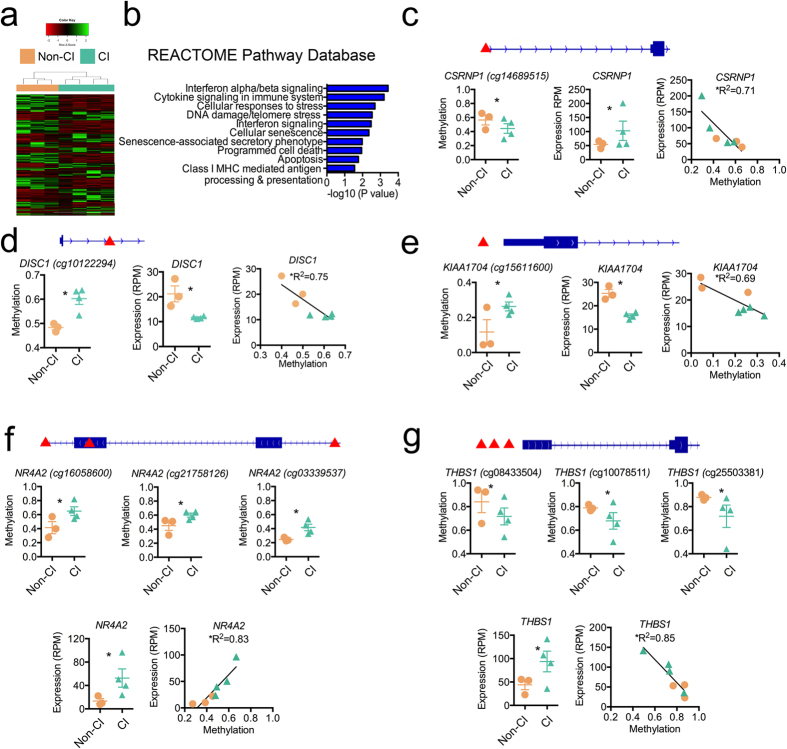
Figure 3. Relationship of CI-associated DNA methylation and gene expression in monocytes.
(a) Heatmap of 496 differently expressed genes comparing Non-CI (orange) and CI (green) monocyte samples. Unsupervised hierarchical clustering analysis (Manhattan distance, complete linkage method) above columns identified 2 main clusters: Non-CI (orange) and CI (green). Expression values displayed ranging from low expression (red) to high expression (green). (b) Gene enrichment of differentially expressed genes from REACTOME Pathway Database. (c) CI-associated DNA methylation significantly associated with altered expression of CSRNP1 gene (r = −0.84, P = 0.01), (d) DISC1 gene (r = −0.87, P = 0.01), (e) KIAA1704 gene (r = −0.83, P = 0.02), (f) NR4A2 gene (r = 0.91, P = 0.004), and (g) THBS1 gene (r = −0.92, P = 0.003). (c–g) Gene structures displayed in blue above graphs and location of CpG sites indicated by red arrows. Methylation values presented as β-values and expression quantified as reads per million (RPM). Orange circle (Non-CI) and green triangle symbols (CI).

