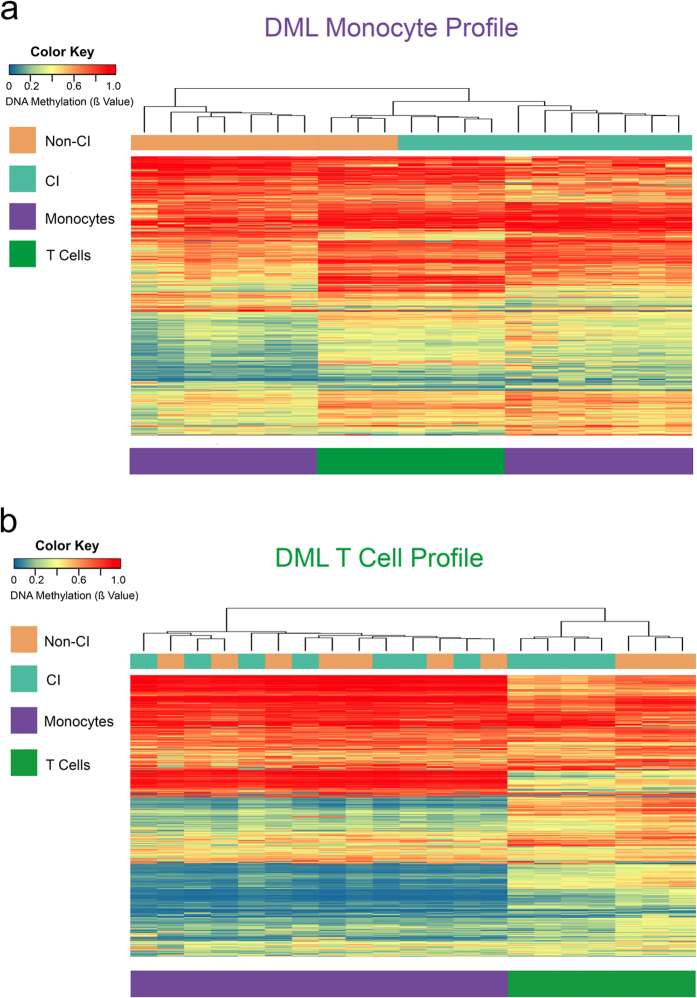
Figure 5. CI-associated DML in monocytes stratifies CI in T cells.
Heatmap displaying methylation levels of differentially methylated loci in Non-CI (orange) and CI (green) monocyte (purple bar) and T cell (green bar) samples. (a) Using monocyte DMLs, unsupervised hierarchical clustering (Manhattan distance, complete linkage method) above columns shows monocytes stratify from T cells in 3 distinct clades and Non-CI stratifies from CI samples. In contrast, (b) using T cell DMLs, unsupervised hierarchical clustering above columns only shows monocytes stratify from T cells, but Non-CI does not stratify from CI samples in monocytes. Methylation values displayed as ranging from low methylation (0; blue) to high methylation (1, red).

