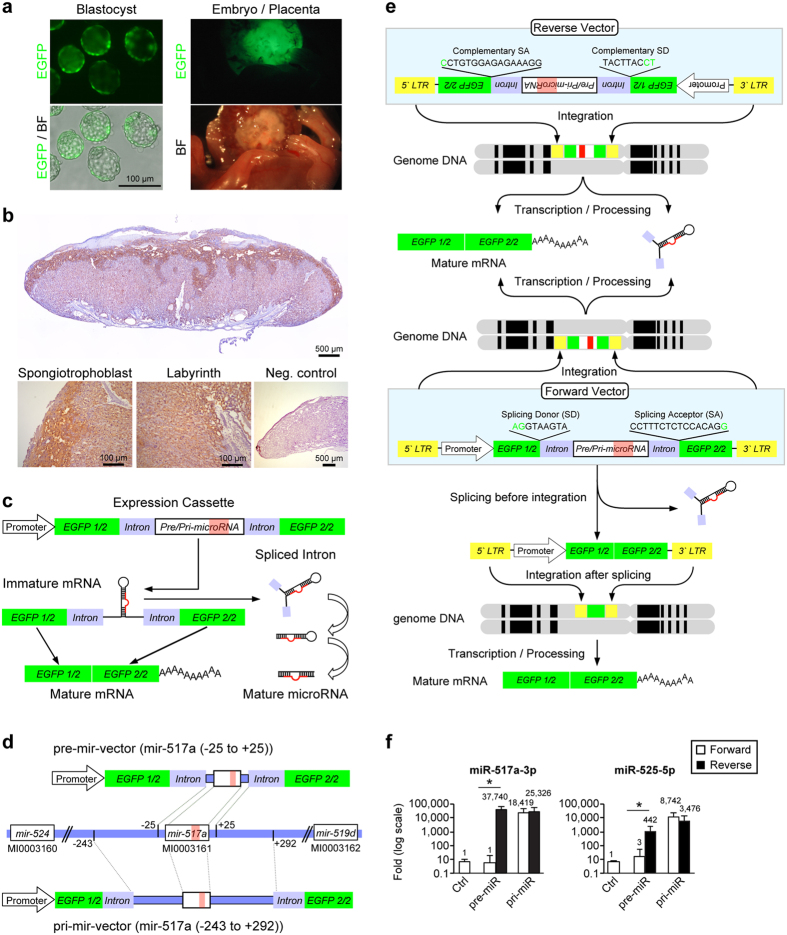
Figure 1. Trophoblast lineage-specific gene manipulation and expression strategy.
(a) Blastocysts after lentivirus exposure under 488 filter set (upper left), and a combined image with bright field (BF) (bottom left). Embryo and placenta after abdominal delivery on E18.5 under 488 filter set (upper right) and under bright field (BF) (bottom right). (b) The expression of EGFP protein in the mouse placenta, detected by immunohistochemistry as described in Methods. Low (2X) and high (10X) magnifications show GFP expression in the labyrinth and junctional zone. (c) A schematic depiction of the eGFP-intron splicing system, designed to express mature miRNA. (d) A schematic depiction of pre-mir-vector and pri-mir-vector of mir-517a. (e) A schematic depiction of the forward- and reverse-vectors, showing the significance of pre-integration splicing in our design strategy. (f) RT-qPCR analysis of expression of miR-517a-3p (upper graph, n = 7–10) and miR-525-5p (lower graph, n = 5–10) for mouse placentas, performed separately for each vector. *Denotes p < 0.01.

