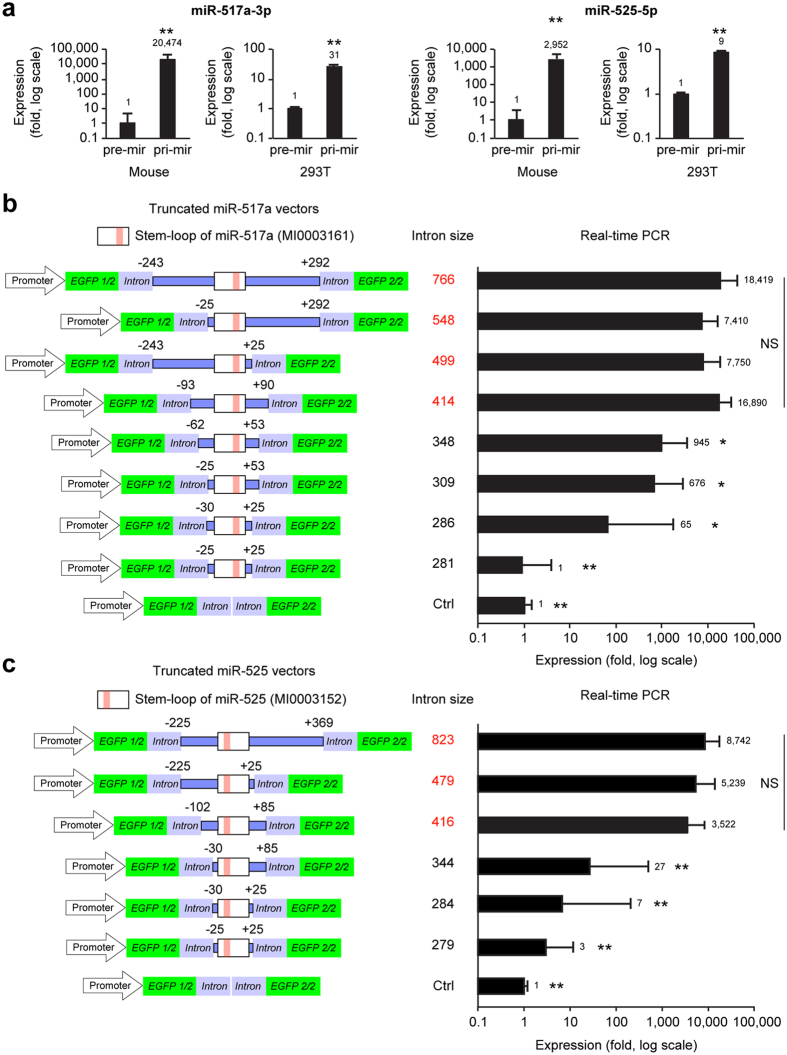
Figure 3. The effect of intron size on miRNA expression efficiency.
(a) The expression levels of miR-517a-3p and miR-525-5p using forward-pre-mir-vector and forward-pri-mir-vector in the mouse placenta in vivo (n = 5–12) and in 293T cells in vitro (n = 3). (b,c) A truncation series of the flanking arms within the mir-517a vector (b, n = 5–20) or the mir-525 vector (c, n = 5–21). The left panel schematics depict the truncation series, and the right panels depict expression levels determined using RT-qPCR. *Denotes p < 0.05, **denotes p < 0.01.

