
Figure 1. Foliar δ13C of Z30 and Z16 under three fertilizer levels.
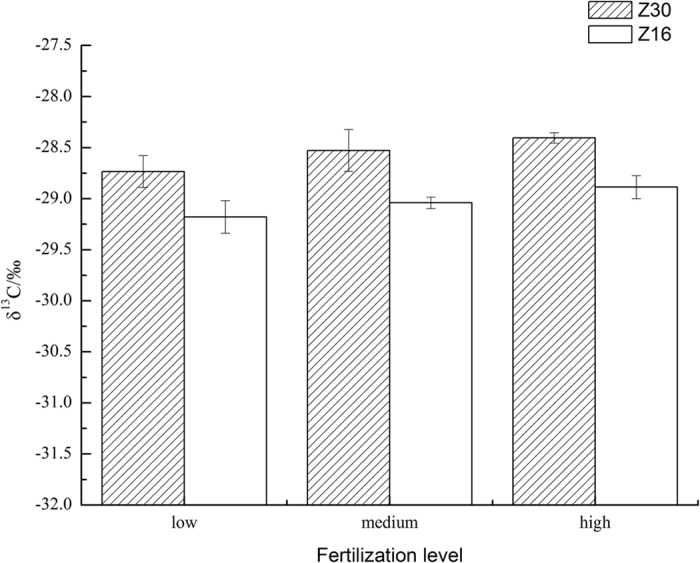
Z30: shaded columns; Z16: blank columns. The errors bars denote 1 standard error. N = 6 for each treatment.
Official websites use .gov
A
.gov website belongs to an official
government organization in the United States.
Secure .gov websites use HTTPS
A lock (
) or https:// means you've safely
connected to the .gov website. Share sensitive
information only on official, secure websites.
Z30: shaded columns; Z16: blank columns. The errors bars denote 1 standard error. N = 6 for each treatment.