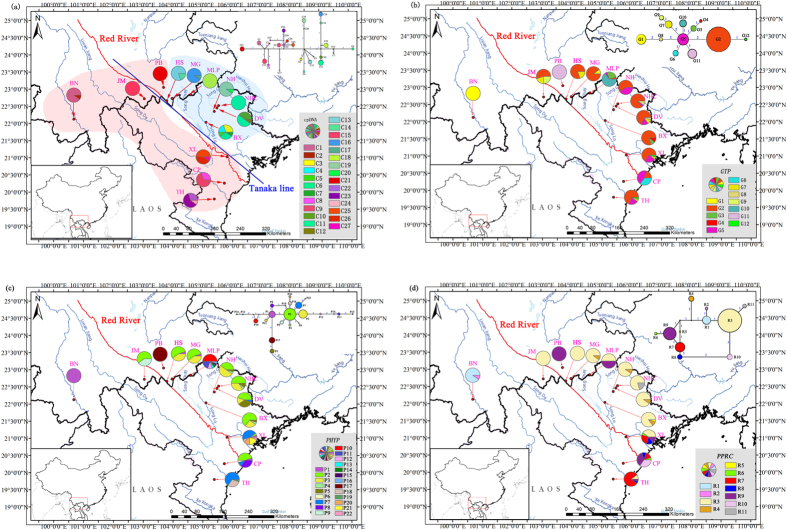
Figure 1.
Sampling sites and geographical distributions of chlorotypes (a) and nuclotypes ((b) GTP; (c) PHYP; (d) PPRC) identified in the 13 populations of C. dolichophylla along the RRF, with networks of each haplotype displayed on the upper right corner. The sizes of the circles in the networks are proportional to the observed frequencies of the haplotypes and numbers above the lines mean the mutational steps. The black dots are the missing haplotypes. The red curve represents the Red River, separating this species into two lineages: the pink shadow area comprises populations from southwestern clade and the light blue area occupied by northeastern clade. The blue straight line in Fig. 1a stands for the modified ‘Tanaka line’. Maps were drawn using the software ArcGIS version 10.2 (http://desktop.arcgis.com) and modified using Photoshop (Adobe Corporation, California, America).

