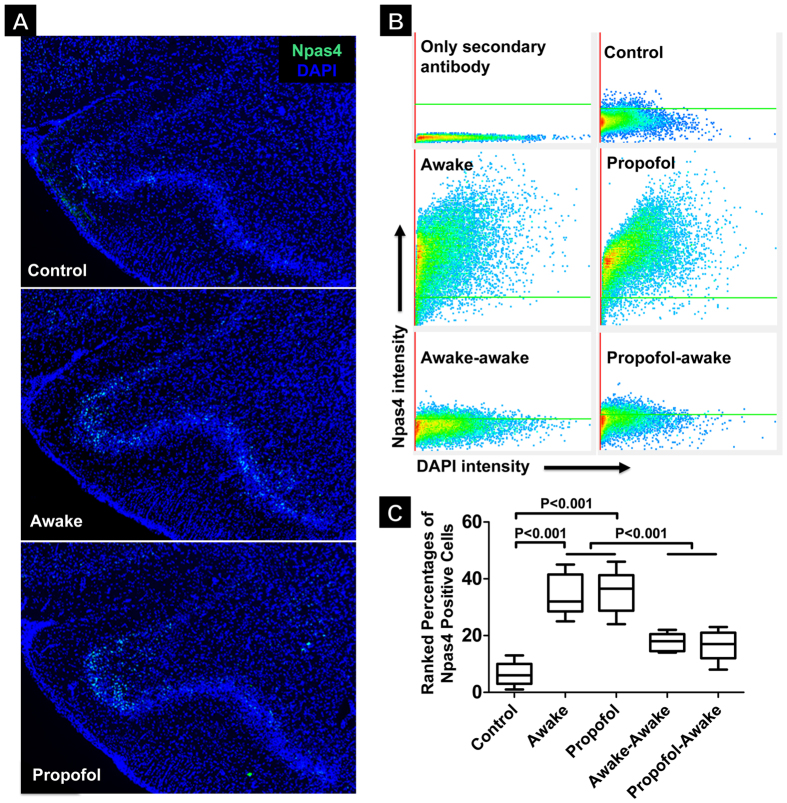
Figure 2. Learning-associated transcriptional programming as revealed by Npas4 activation.
(A) Representative transverse sections of Npas4 staining (green) in the anterior piriform cortex (APC). (B) Scatter plots of fluorescence intensities for Npas4 and DAPI immunostaining in Layer II of APC under various conditions. The green lines mark two standard deviations (upper ~95% confidence interval) above the mean Npas4 background fluorescence in the control group. Cells with fluorescence intensity above this threshold are considered Npas4 positive. (C) Quantification by percentage of Npas4+ cells in Layer II of APC (Box and whisker show the median, 25th and 75th percentiles, and the full data range; n = 5–14 sections from three rats in each group). The P values were derived from analysis of variance on the ranked data with post hoc pairwise comparisons. Control, animals that were handled identically to the experimental groups but received no odor stimulations; Awake, animals that learned a novel odorant for 20 min under a fully awake condition; Propofol, animals that were exposed to a novel odorant for 20 min after fully anesthetized by propofol; Awake-awake, animals that learned a novel odorant while awake and then relearned the same odorant while awake 24 h later; and Propofol-awake, animals that were exposed to a novel odorant under propofol anesthesia and then relearned the same odorant while awake 24 h later.

