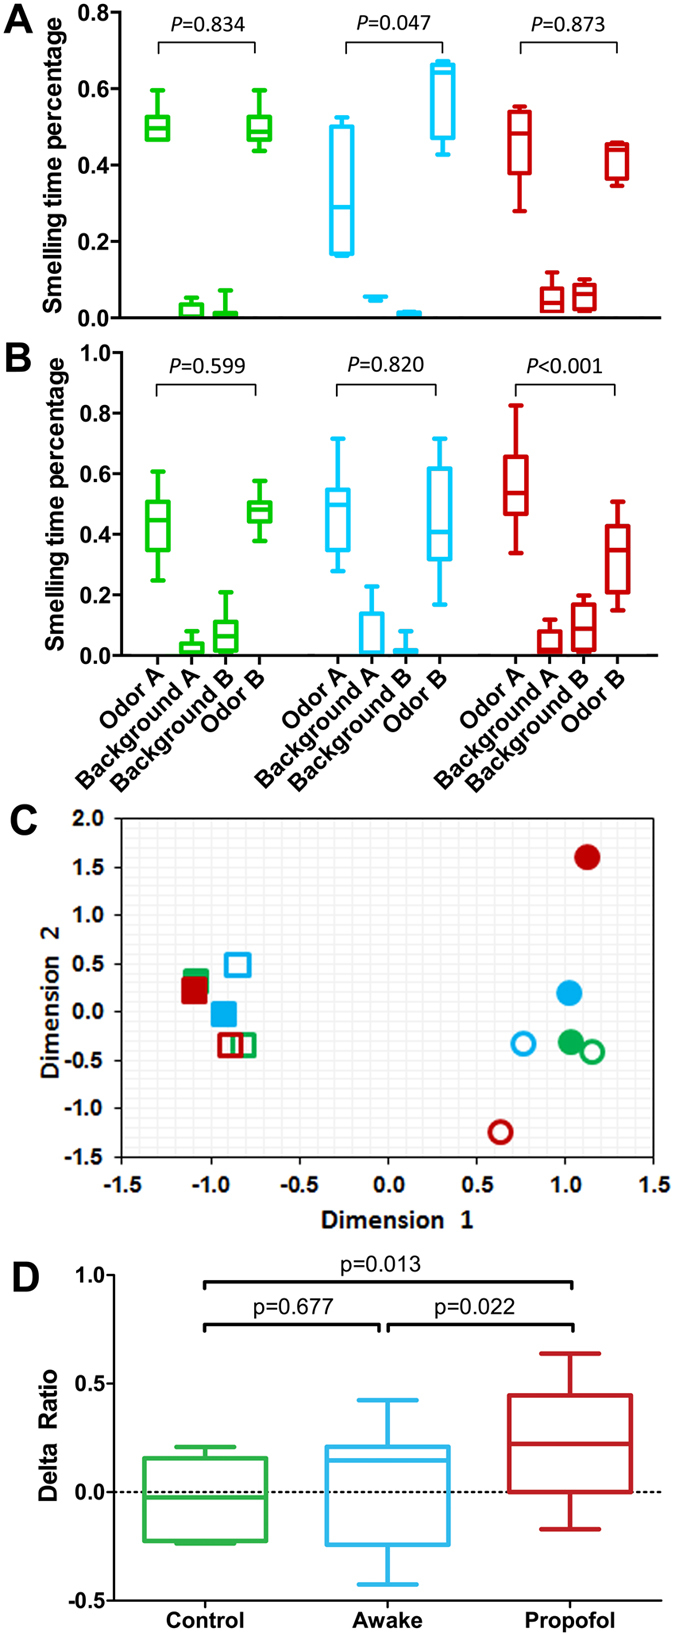
Figure 3. Forced-choice memory tests after learning and relearning a pure odorant.

(A) Percentage of time spent smelling each of four beads is normalized against the total smelling time during the first recognition test depicted in Fig. 1 (i.e., after initial learning). For the Control (green), Awake (cyan), or Propofol (red) group, Odor A was novel, previously learned under the awake condition, or previously presented under propofol anesthesia, respectively. Odor B was novel to all groups during this phase of behavioral testing. Background A and Background B were two beads from the animals’ home cage as a familiarity reference. (B) Percentage of time spent smelling each of the four beads during the second recognition test in Fig. 1 (after relearning). Group colors are the same as in (A). Odor A was used in the initial learning for the awake and propofol groups, and both Odor A and Odor B were used in the conscious relearning for all groups. (C) Correspondence analysis of the discretized data from (B). Color scheme is the same as in (A,B). Solid and open circles are Odor A and Odor B, respectively, and solid and open squares are Background A and B, respectively. (D) The delta ratios were calculated from (B) as (Odor A − Odor B)/(Total Smelling Time). Propofol-induced relearning deficit is clearly indicated as a significantly higher percentage of time spent on the odorant initially learned under anesthesia. Box and whisker plots display the median, 25th and 75th percentile, and the full range from n = 6–12 rats per group. The p values were obtained from pairwise Kruskal-Wallis non-parametric test for (A) and (B), and ANOVA with least significant difference post hoc test for (D).
