
Figure 5. Knockdown of KATNB1 orthologs in zebrafish and Drosophila results in small brain phenotype.
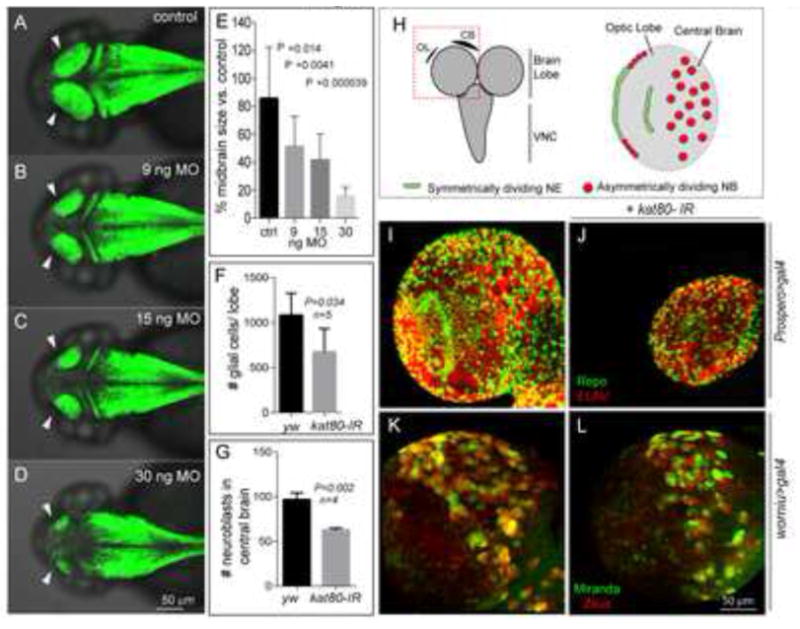
katnb1 morpholino reduces zebrafish midbrain size: Confocal microscopy shows that the katnb1 morphants at (B) 9 nanogram (ng), (C) 15 ng, and (D) 30 ng have smaller midbrains (arrows) as compared with (A) control at 2 days post fertilization (dpf). The reduction in brain size is statistically significant (E). Zebrafish brain is labeled with green fluorescence by Tg(HuC:Kaede). (H) Left panel: Schematic of the Drosophila brain; box indicates brain lobe imaged. Right panel: Schematic of a single brain lobe marks the location of symmetrically dividing neuroepithelium (NE, green) and asymmetrically dividing neuroblasts (NBs, red). (I, J) Expression of kat80-IR with prospero-Gal4 results in a dramatically reduced brain size in 3rd instar larvae. There is an overall reduction in the number of neurons and glia generated as seen by ELAV (red) and Repo (green) staining, respectively. (K, L) kat80-IR expressed under worniu-Gal4, UAS-mir::GFP, UAS-zeus::mCherry results in a significant reduction in NB number in central brain. Images in F–I are 3D projection of identical Z-sections. (F) Quantification of glial cell counts seen in panel F–G. There is significantly reduced number of glial cells in kat80-IR larvae (Error bars indicate SD, yw: 1080±110; kat80-IR: 673±116; two-tailed test, P=0.034). (G) GFP- and RFP-positive cells were quantified using 3D projections of identical Z-stacks from worniu>gal4 and worniu>kat80-IR brains, which reveal a significant reduction in central brain NBs per brain lobe (yw: 96.5±7.9; kat80-IR: 62.5±2.3; P = 0.002). (See also Figure S3)