
Figure 7. kat80-IR results in centrosomal defects and reduced neuroblasts in Drosophila optic lobe.
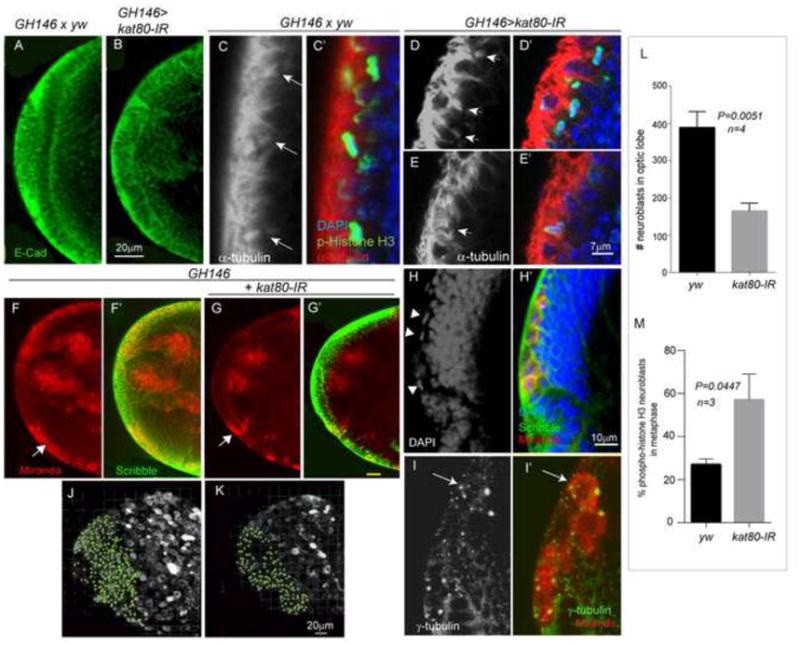
Expression of kat80-IR with GH146-gal4 does not affect the morphology of the neuroepithelium (NE, marked by E-cadherin staining (green) in A, B) or spindle orientation (C–E′). In C–E′, arrows mark the mitotic spindles and staining with alpha tubulin (red), phospho-histone H3 (pH3, marking the metaphase plate in the neuroepithelial cells, green) and DAPI (marking the nuclei, blue) are shown. Panels C, D, E show α-tubulin staining only (gray scale) for easier visualization of the mitotic spindle. (F–G′) Expression of kat80-IR in the optic lobe results in significantly reduced number of NBs (arrow). Miranda (marking NBs, red) and Scribble (marking NE cells) staining is shown in wild-type (yw, F-F′) versus kat80-IR (G-G′) larval brains. H and H′ are high magnification images of the kat80-IR brain in G, indicating that the NBs in kat80-IR brains are mainly in metaphase (arrowheads). (I-I′) GH146>kat80-IR brains also show increased number of centrosomes in NBs as seen by gamma-tubulin staining (green) in miranda-positive NBs (red). (J–K) 3D projections of identical Z-sections of GH146>kat80-IR and wildtype (yw) brains showing reduced number of miranda positive NBs in the optic lobe of 3rd instar larval brains. (L) Quantification of the miranda positive cells in the optic lobe shows significantly reduced NBs in the kat80-IR brains (yw: 389±24.8; kat80-IR:165 ±10.5; two-tailed t-test P = 0.005). (M) Quantification of phosphor-histone H3 (pH3) positive NBs in kat80 depleted brains shows an increase in the number of pH3 positive NBs in metaphase (also visible in panel H) (yw: 26.9±1.5; kat80-IR: 57±7; two-tailed t-test, P =0.04) suggesting delayed anaphase onset. (See also Figure S4)