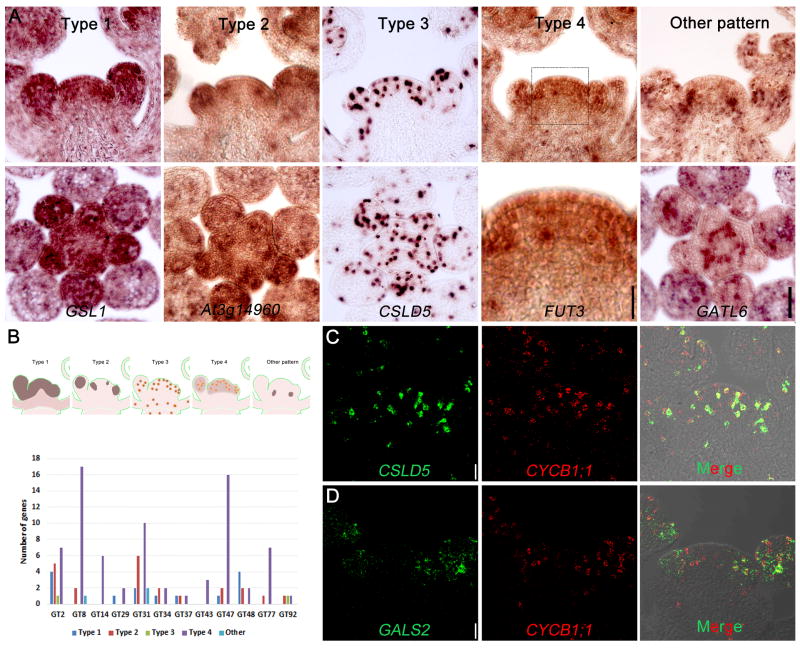
Figure 3. Localisation of Glycosyltransferase (GT) Gene mRNAs in Shoot Apex by In Situ Hybridization.
(A) The expression patterns of glycosyltransferase genes expressed in shoot apex. The GTs were classified into five patterns according to their mRNA distribution. One representative gene for each type was shown in both longitudinal (top panel) and transverse (bottom panel) sections. Scale bar = 50 μm except for Type 4 bottom panel, which is 20 μm.
(B) A sketch showing the expression patterns of GTs and summary of gene number in each GT family that are classified into different expression patterns.
(C, D) Co-expression of GT genes with Cyclin B1;1 that marks dividing cells by dual labelling fluorescent in situ hybridization. Scale bar = 20 μm.

