
Figure 4.
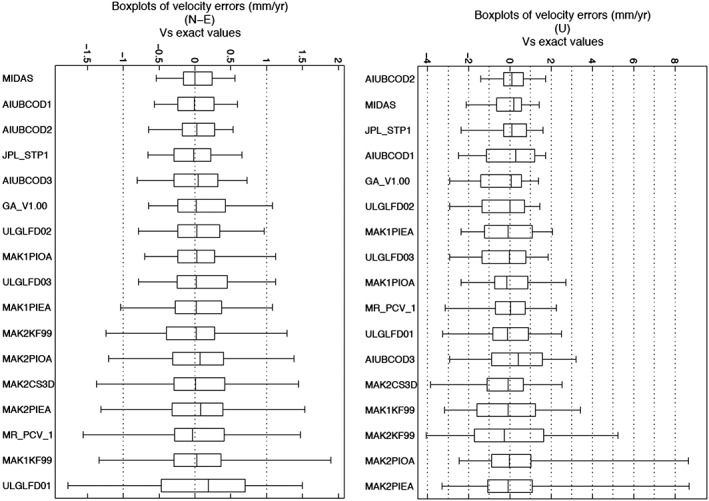
Boxplots summarizing the velocity error distributions using the DOGEx synthetic data for (left) north and east components and (right) up component. Results are from MIDAS and from least squares using steps identified by 16 of the best automatic step detection programs. The box width is the IQR, and the central line is the median. The width between whiskers is the IPR. Boxplots are ranked top to bottom in order of increasing IPR. MIDAS outperforms least squares with step detection.