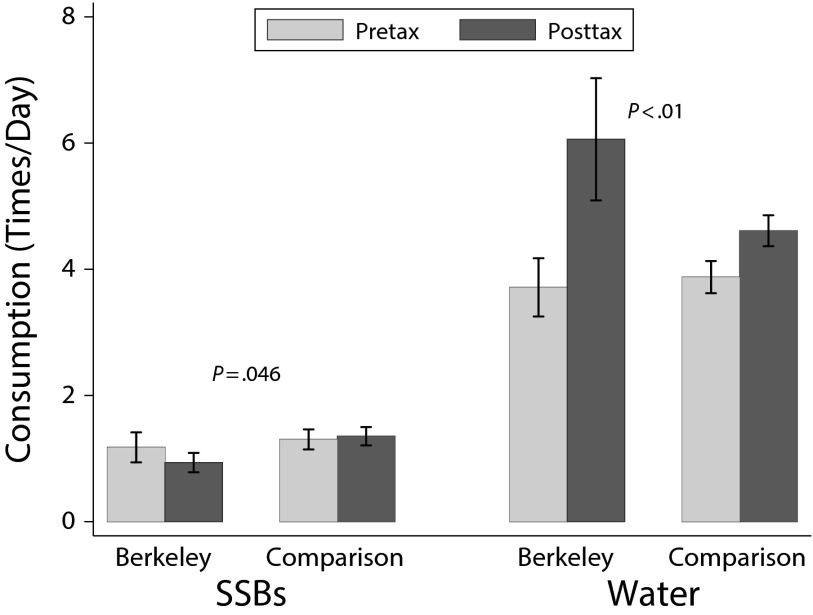
FIGURE 2—
Adjusted Mean Consumption of Sugar-Sweetened Beverages (SSBs) and Water Before and After the Tax in Berkeley, CA, and Comparison Cities (Oakland and San Francisco, CA)
Note. Adjusted means and 95% confidence intervals were obtained by using the margins command in Stata/IC version 13.1 (StataCorp LP, College Station, TX) after running generalized linear models adjusting for neighborhood, gender, age, education, race/ethnicity, and language. P values shown are for the difference between Berkeley and comparison cities in change in consumption and come from the generalized linear models.

