
Fig. 1.
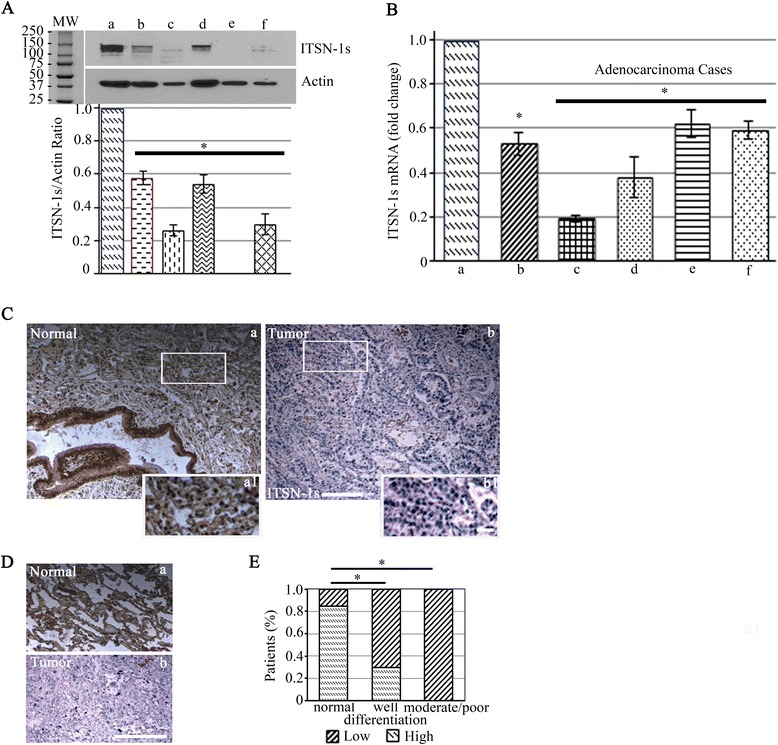
ITSN-1s protein and mRNA levels are decreased in LC patients. a WB using ITSN-1 Ab of cell and lung tissue lysates resolved by SDS PAGE (70 μg total protein/lane). Human LC cells (b - f) were compared to control bronchial cells (a). The cell lines were as follows: b- A549, c- H358, d- H1703, e- H1437, f- H2009; MW – molecular weight. Data are shown as ITSN-1s/actin ratio. The bands between MW 100–150 were included in densitometry analysis. b qPCR analyses of ITSN-1s mRNA levels in A549 cells (b) and lung adenocarcinoma cases (c–f) compared to controls (bronchial cells and normal tissue) (a). Data are shown as percentage decrease by comparison to controls. Error bar represents mean ± SE; *p < 0.05. The above data are representative of 3 independent experiments performed under identical experimental conditions. c Representative ITSN-1s IHC staining of paraffin-embedded adjacent normal lung tissues (a, a1) and lung adenocarcinoma tissue (b, b1). d Representative ITSN-1s IHC staining of TMA specimens from normal lung (a) and lung adenocarcinoma (b). e The percentage of patients with high and low ITSN-1s protein level were calculated in 3 groups: normal, well-differentiated and moderately or poorly differentiated. Images were acquired using identical parameters. Bars: 20 μm (a, b); 5 μm (a1, b1)