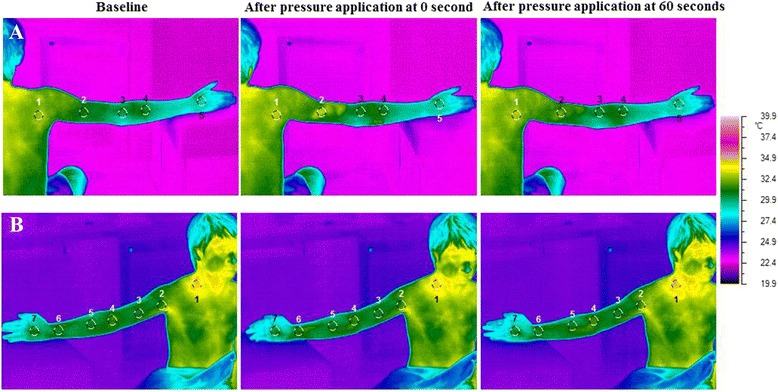
Fig. 5.

The alteration of ST before and after pressure application at different MaSPs. a represents pressure application at MaSP-LA-2 or area 2. This posterior thermographic image view demonstrates 4 other measurement points proximal and distal to the MaSP. Note the color change in area 2 after pressure application. b Press at MaSP-SH-4 or area 1, thermographic images were analyzed seven areas from proximal to distal area of posterior image view. Area 1, color was changed to light color after press that represented increasing of ST in that area. Changes in color denote changes in temperature according to the color scale below
