
Fig. 7.
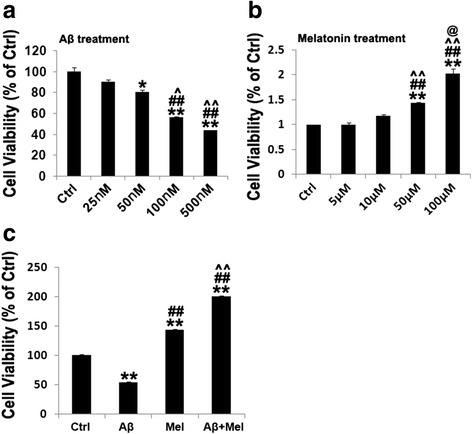
Effects of Aβ1–42, melatonin, and Aβ1–42 plus melatonin on cell viability in hippocampal neurons. a Dose-dependent effect of Aβ1–42 on cell viability. *p < 0.05 and **p < 0.01 compared with control cells; ## p < 0.01 compared with 25 nM Aβ1–42-treated cells; ^ p < 0.05 and ^^ p < 0.01 compared with 50 nM Aβ1–42-treated cells. b Dose-dependent effect of melatonin on cell viability. **p < 0.01 compared with control cells; ## p < 0.01 compared with 5 μM melatonin-treated cells; ^^ p < 0.01 compared with 10 μM melatonin-treated cells; @ p < 0.05 compared with 50 μM melatonin-treated cells. c Effect of 50 μM melatonin on cell viability of 100 nM Aβ1–42-treated hippocampal neurons. **p < 0.01 compared with control cells; ## p < 0.01 compared with Aβ1–42-treated cells; ^^ p < 0.01 compared with melatonin-treated cells. Ctrl control cells, Aβ Aβ1–42-treated cells, Mel melatonin-treated cells, Aβ + Mel Aβ1–42 and melatonin-treated cells