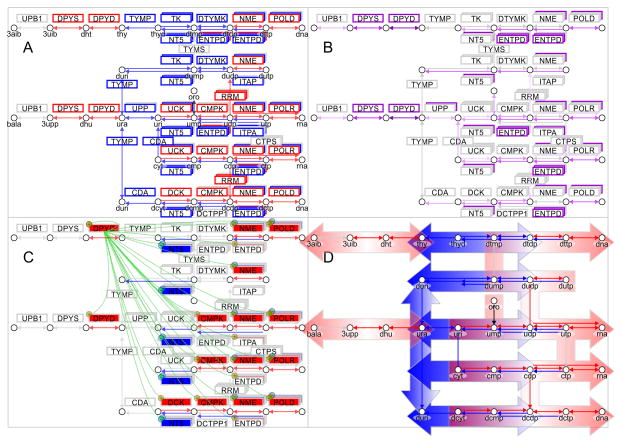
Figure 6. Somatic mutations of DPYD in TCGA SKCM enhance metastatic signature of melanoma and promote deregulation of the pyrimidine pathway toward malignant cancer progression.
A) Gene expression signature is plotted onto pathway map of pyrimidine metabolism in metastatic melanoma (KEGG pathway ID:00240). On the left side enzymes DPYD, DPYS and UPB1 are responsible for pyrimidine degradation, in the center TYMP connects uracil derivatives, and at the right pyrimidine kinases DTYMK and CMPK, nucleoside diphosphate kinases NME, and polymerases POLD and POLR provide synthesis of DNA and RNA nucleic acids. B) Frequency of somatic mutations in pyrimidine enzymes is color coded from 0% in grey to 25% in purple in metastatic melanoma (Supplementary Table 5). C) Impact of DPYD mutations on enzymes of pyrimidine metabolism is indicated by regulatory symbols and shading of enzyme boxes (red, plus) for enhancement and suppression (blue, minus) (Supplementary Table 8). Somatic frequency of mutations, enhanced gene expression signature of patients with DPYD mutations are provided in supplementary tables. D) Pathway map shows separation and directionality of upregulated pyrimidine degradation (red, left) and nucleic acid synthesis (red, right) by down-regulated uracil and thymidine salvage (blue, center). Concerted dysregulation of metabolic enzymes at a pathway level contributes to bifurcation of pyrimidine metabolism. The systems biology maps depict metabolites as circles, reactions with their respective directionality as arrows, and enzymes as boxes. Enzymes of anabolic direction are shown above reactions and enzymes of catabolic direction below reactions. Staggered boxes indicate metabolic redundancy that multiple genes encode enzymes for the reaction.

