Figure 10.

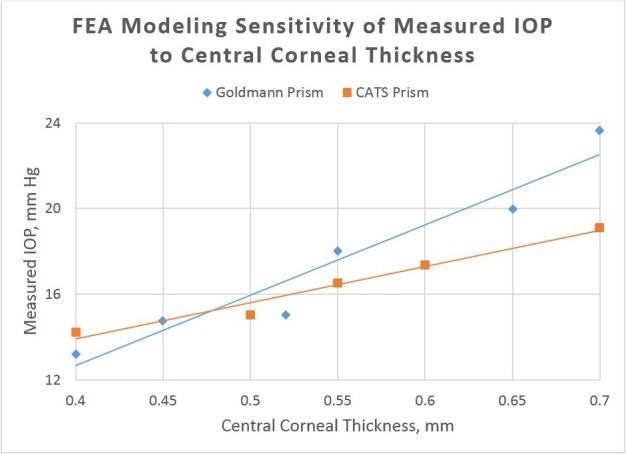
Finite element analysis modeling CCT error sensitivity with constant Young's modulus, constant corneal curvature, and constant IOP (note reduced slope indicating decreased error sensitivity with the CATS prism).

Finite element analysis modeling CCT error sensitivity with constant Young's modulus, constant corneal curvature, and constant IOP (note reduced slope indicating decreased error sensitivity with the CATS prism).