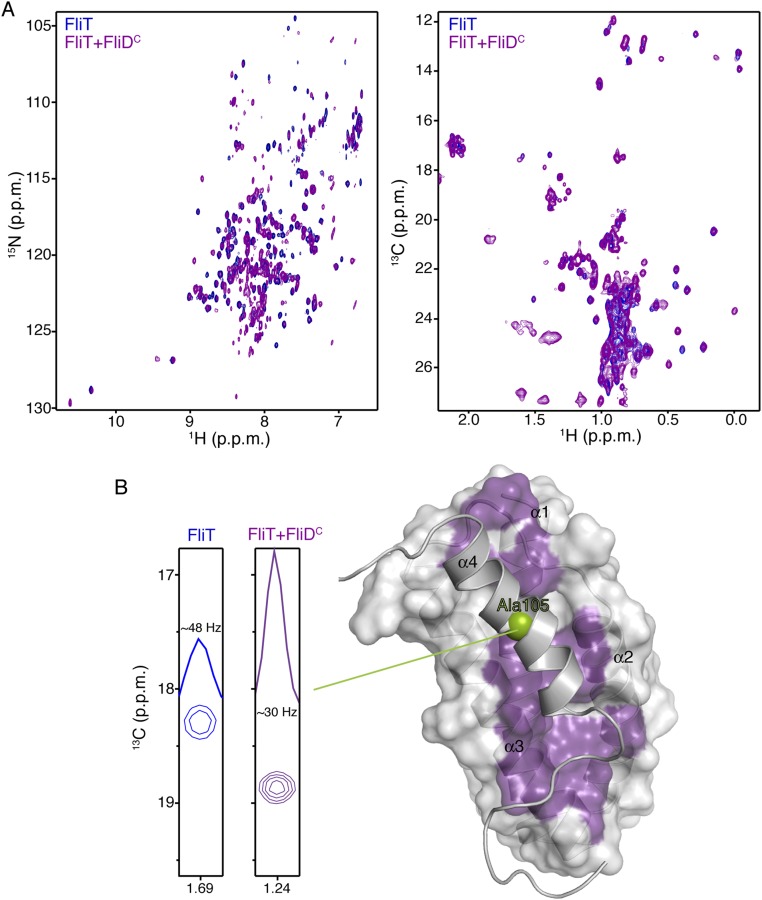
Fig. S3.
NMR studies of FliDC binding to FliT. (A) 1H-15N HSQC (Left) and 1H-13C HMQC (Right) spectra of U-2H,15N Ala-13CH3, Met-13CH3, Ile-δ1-13CH3, Leu,Val-13CH3/13CH3, and Thr-13CH3 of free FliT (blue) and of FliT in complex with FliDC (purple). FliT is in excess to ensure that all FliDC, which has a tendency to aggregate, is bound to FliT. (B) NMR analysis shows that FliDC binds to the hydrophobic surface formed by FliT helices a1–a3 (purple surface) and that helix α4 is displaced. The enhanced mobility of helix α4 in the complex was confirmed by analysis of the linewidth of the helix α4 residues (Ala105 is shown here).

