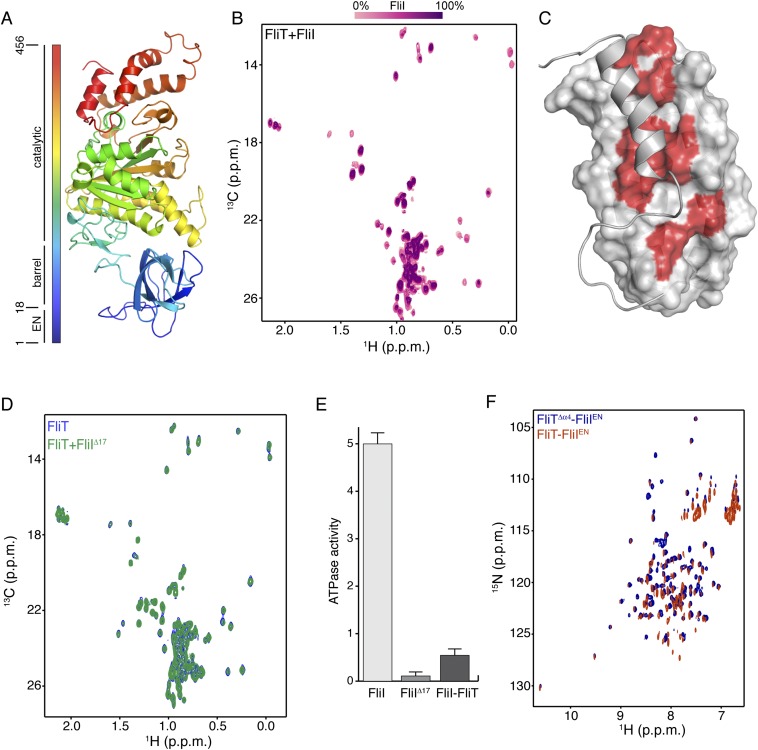
Fig. S8.
Interaction between FliT and FliI. (A) Structure of FliI (PDB ID code 2DPY). The extreme N-terminal region was not crystallographically resolved and is modeled here as an unstructured region. (B) Stepwise titration of unlabeled FliI to U-2H–,15N Ala-13CH3–, Met-13CH3–, Ile-δ1-13CH3–, Leu,Val-13CH3/13CH3–labeled FliT. (C) The FliT residues affected by FliI binding are colored red on the FliT surface. (D) NMR spectra show that the FliIΔ17 variant does not bind to FliT. (E) ATPase activity of FliI, FliIΔ17, and FliI in complex with FliT. The ATPase activity is expressed in nanomoles of hydrolyzed ATP per microgram of protein. (F) 1H-15N HSQC spectra of FliT−FliIEN (orange) and FliTΔα4−FliIEN (blue) complexes show very similar chemical shifts.

