Fig. 6.
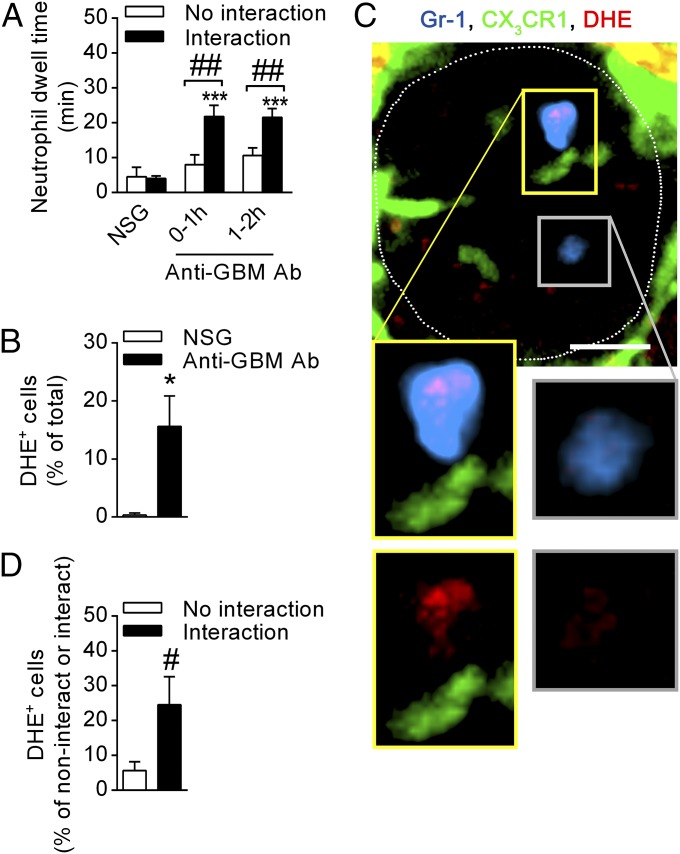
Monocyte–neutrophil interactions are associated with prolonged neutrophil dwell time and increased ROS production. Neutrophil behavior in relation to monocyte–neutrophil interactions was determined using SDCM in Cx3cr1GFP/+ mice, after NSG or anti-GBM Ab administration. (A) Neutrophil dwell time shown for neutrophils that did or did not undergo interaction with monocytes 0–1 h after NSG (n = 7), or 0–1 h (n = 7) or 1–2 h after anti-GBM Ab injection (n = 8). ***P < 0.001 vs. NSG; ##P < 0.01 vs. “No interaction.” (B–D) Data from separate experiments analyzing ROS production in interacting and noninteracting neutrophils. (B) Percentage of adherent neutrophils that were DHE+ 1–2 h after treatment with either NSG (n = 3) or anti-GBM Ab (n = 8). (C) SDCM images of a glomerulus (outlined) in a Cx3cr1GFP/+ mouse 1–2 h after anti-GBM Ab administration showing an oxidant-positive (red, DHE) neutrophil (blue, Gr-1) in close proximity to a GFP+ monocyte (green). An oxidant-negative neutrophil is also present. Insets in the Top image are enlarged in the Bottom panels and show neutrophils in the presence or absence of Gr-1 staining, for either an interacting neutrophil (panels outlined in yellow) and a noninteracting neutrophil (outlined in gray). (Scale bar: 10 μm.) See also Movie S7. (D) Percentage of DHE+ neutrophils that did or did not undergo interaction with monocytes 1–2 h after anti-GBM Ab (n = 8). Data are presented as mean ± SEM; *P < 0.05 vs. NSG, #P < 0.05 vs. “No interaction.”

