Fig. 1.
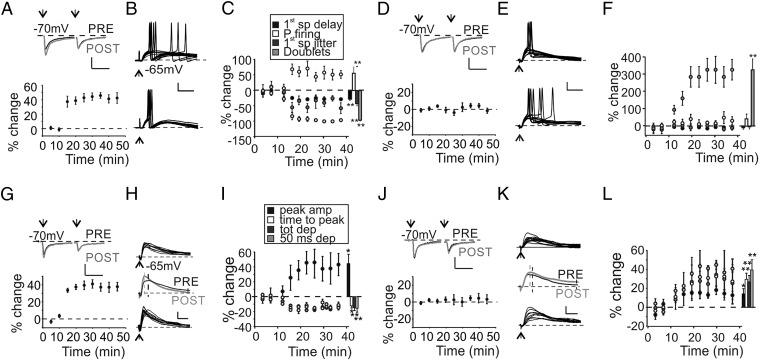
Impact of TBS on GrC activity. (A, Upper) Average EPSCs obtained before (black) and after (gray) TBS in a GrC undergoing LTPglu. (Scale bar: 10 ms, 20 pA.) (Lower) Time course of normalized EPSC changes (n = 6). (B) Voltage traces taken from the same GrC shown in A and generating suprathreshold responses following a single mf impulse before (Upper) and after (Lower) TBS. (Scale bar: 10 ms, 20 mV.) (C) Time course of spike-related parameters. Histogram summarizes average changes in cells undergoing LTPglu (first spike delay −28.4 ± 4.3%, **P < 0.01; first spike SD −43.4 ± 7.2%, **P < 0.01; P firing +53.5 ± 19.4%, **P < 0.01; doublets −95.7 ± 2.3%, **P < 0.01, n = 6 cells). (D, Upper) Average EPSCs obtained before (black) and after (gray) TBS in a GrC in which LTPglu was not expressed. (Scale bar: 10 ms, 20 pA.) (Lower) Time course of normalized EPSC changes (n = 4). (E) Voltage traces taken from the same GrC shown in D. (Scale bar: 10 ms, 20 mV.) (F) Time course of spike-related parameters. Histogram summarizes average changes in cells in which LTPglu was not expressed (first spike delay −8.3 ± 3.3%, P > 0.1; first spike SD +4.5 ± 15.4%, P > 0.9; P firing +40.9 ± 22.7%, P < 0.08; doublets +322.2 ± 57.2%, **P < 0.01, n = 4 cells). (G, Upper) Average EPSCs obtained before (black) and after (gray) TBS in a GrC undergoing LTPglu and showing subthreshold activity in response to a single mf impulse. (Scale bar: 10 ms, 10 pA.) (Lower) Time course of normalized EPSC changes (n = 5). (H) Voltage traces taken from the same GrC shown in G before (Upper) and after (Lower) TBS. (Scale bar: 10 ms, 5 mV.) (I) Time course of EPSP-related parameters. Histogram summarizes average changes on EPSP properties in cells undergoing LTPglu [peak amp +45.3 ± 11.1%, *P < 0.05; time to peak −12.8 ± 2.5%, *P < 0.05; total depolarization (tot dep) −14.9 ± 2.4%, **P < 0.01; depolarization at 50 ms poststimulus (50 ms dep) −16.6 ± 4.2%, **P < 0.01, n = 5 cells]. (J, Upper) Average EPSCs obtained before (black) and after (gray) TBS in a GrC in which LTPglu was not expressed and showing subthreshold activity in response to a single mf impulse. (Scale bar: 10 ms, 10 pA.) (Lower) Time course of normalized EPSC changes (n = 5). (K) Voltage traces taken from the same GrC shown in J. (Scale bar: 10 ms, 5 mV.) (L) Time course of EPSP-related parameters. Histogram summarizes average changes on EPSP properties in cells in which LTPglu was not expressed (peak amplitude +13.9 ± 6.4%, *P < 0.05; time to peak +29.7 ± 9.1%, **P < 0.01; tot dep 26.8 ± 6.8%, **P < 0.01; 50 ms dep +39.5 ± 10.3%, **P < 0.01, n = 6 cells).

