Fig. 2.
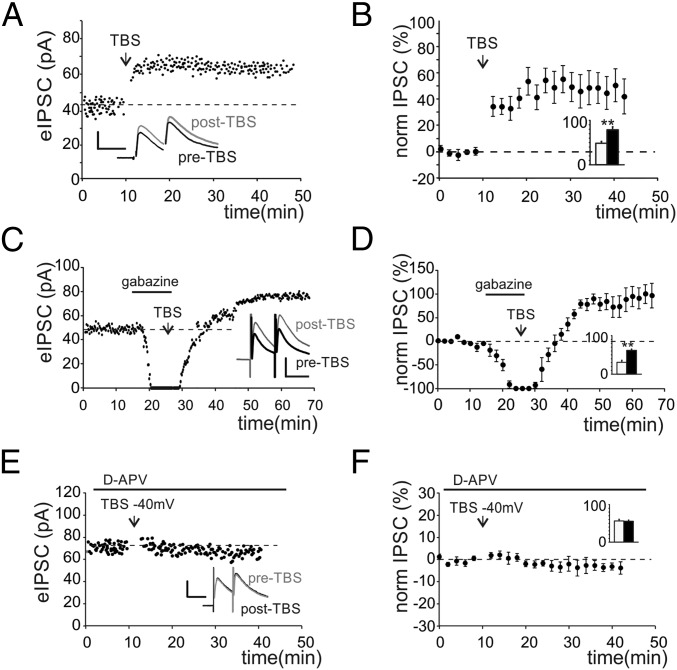
TBS potentiates the activity of GoC–GrC synapses. (A) Time course of IPSC first peak amplitude in a single GrC. Traces in the Inset show average responses before (black) and after (gray) TBS. (Scale bar: 30 pA, 20 ms.) (B) Time course of normalized IPSC changes (n = 19). Histogram shows average IPSC values before (white) and after (black) TBS (50.1 ± 8.3 pA vs. 80.5 ± 9.7 pA n = 19, **P < 0.01). (C) Time course of IPSCs first peak amplitude in a GrC transiently perfused with gabazine. TBS was delivered during gabazine perfusion (horizontal bar). Traces in the Inset show average responses before (black) and after (gray) TBS. (Scale bar: 40 pA, 20 ms.) (D) Time course of normalized IPSC changes in cells transiently perfused with gabazine (n = 7). Histogram shows average IPSC values (34.2 ± 2.6 pA vs. 62.1 ± 4.7 pA n = 7, **P < 0.01). (E) Time course of IPSCs first peak amplitude in a GrC perfused with d-APV (horizontal bar). Traces in the Inset show average responses before (black) and after (gray) TBS. (Scale bar: 40 pA, 20 ms.) (F) Time course of normalized IPSCs changes (n = 5 cells) obtained from cells perfused with d-APV. Histogram shows average IPSC values (56.4 ± 3.5 pA vs. 54.8 ± 3.9 pA n = 5, P > 0.6).

